 AppGoblin
POSEIDON System Weather
4.5★
Ratings: 671
Screenshots

App Description
POSEIDON forecasting system: Weather, Ocean, Sea State & Ecosystem forecast Maps
POSEIDON System app provides easy access to the updated view of the meteorological, wave, hydrodynamic and ecosystem forecasts provided in POSEIDON System official website poseidon.hcmr.gr. The forecasts are updated daily covering the next five days.
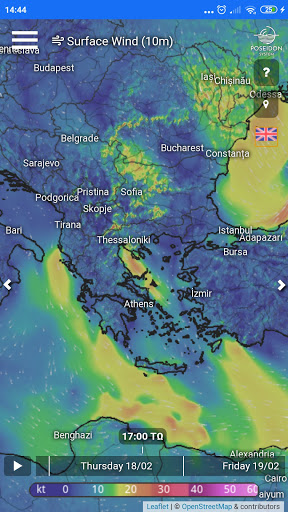
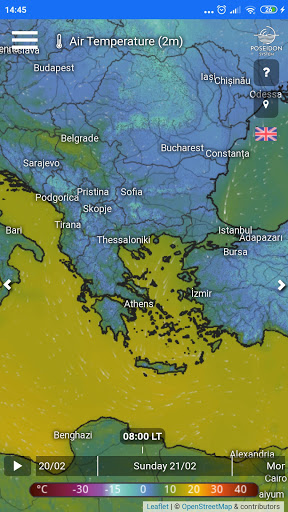
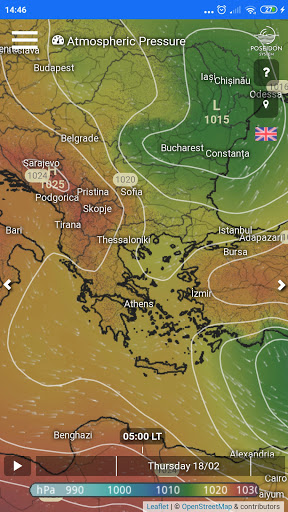
Meteo Forecast:
Spatial coverage: mid and South Europe, Mediterranean Sea and North Africa
• Surface wind (10m)
• Rainfall
• Air Temperature (2m)
• Cloudiness
• Snowfall
• Dust
• Atmospheric Pressure
Waves Forecast:
Spatial coverage: Mediterranean Sea, Sea of Marmara and Black Sea
• Significant Wave Height & Direction (WW3 model)
• Significant Wave Height & Direction (WAM model)
Sea Level Forecast:
Spatial coverage: Mediterranean Sea
• Total Elevation
• Tidal Elevation
• Surge Elevation
Hydrodynamics Forecast:
Spatial coverage: Mediterranean Sea
• Sea Surface Temperature
• Sea Surface Salinity
• Surface (5m) Circulation
Ecosystem Forecast:
Spatial coverage: Mediterranean Sea
• Chlorophyll-a (0-10m average)
• Nitrates (Surface)
• Ammonium (Surface)
• Phosphates (Surface)
• Bacteria Biomass (Surface)
• Mesozooplankton (Surface)
• Phytoplankton Biomass (Surface)
• Primary Production (Surface)
• Bacterial Production (Surface)
• Primary Production (200m Integrated)
• Bacterial Production (200m Integrated)
Color bar: click on the color bar to change units for surface wind (kt, m/s, bft), air temperature (°C, °F) and sea surface circulation (kt, m/s)
Flow Animation: streamlines presenting the flow of the wind, the waves or the sea currents depending on the selected model
Isobars: Add the isobars layer on top of the selected forecast with option under menu
Interactive map: Zoom in and out and move the map to any area of interest.
Point of interest: Clicking on any point on the area covered by the forecasting model, will provide a quick view of the forecast value on the selected point. Clicking on the orange arrow on the tip, will open a summary of the forecast for the whole forecasting period for this point.
City labels: Clicking on city labels, opens a summary of the forecast for the whole forecasting period for the specific ci