S&P Stocks Ratings & Charts
S&P Stocks Ratings & Charts Summary
S&P Stocks Ratings & Charts is a with in-app purchases iOS app in the Finance category, developed by Stockring, Inc.. First released 15 years ago(Mar 2010), the app has 34 ratings with a 4.35★ (good) average rating.
Recent activity: -11 new ratings this week (-11 over 4 weeks) with declining momentum. View trends →
Store info: Last updated on App Store on Aug 16, 2025 .
4.35★
Ratings: 34
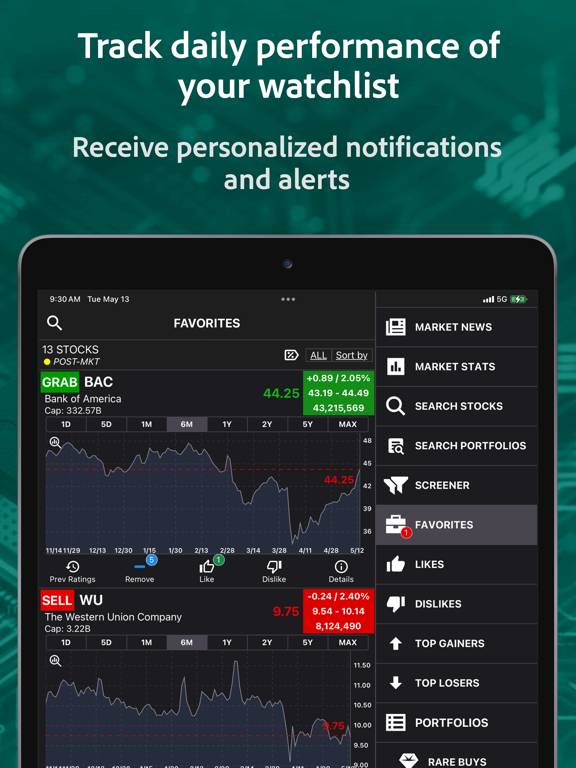
Screenshots

App Description
S&P Stocks App makes it easy to find great stocks from the S&P 1,500 index to buy, follow your favorite stocks, and understand market trends. Get predictions, forecast data, and Buy/Sell recommendations three times daily during market hours. Know when and which stocks to buy and sell, and at what price!
The S&P 1,500 includes the S&P 500 Large Cap, S&P 400 Mid Cap, and S&P 600 Small Cap stocks. Tap any ticker to see key fundamentals, technicals, company profiles, and business news from top publications worldwide. View charts, stock quotes, and daily performance in a personalized watchlist. It is an excellent tool for day traders, and long-term investors with accurate predictions, forecasts, recommendations, and alerts.
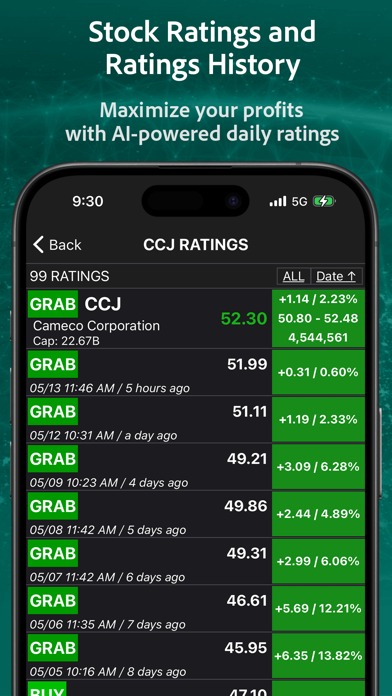
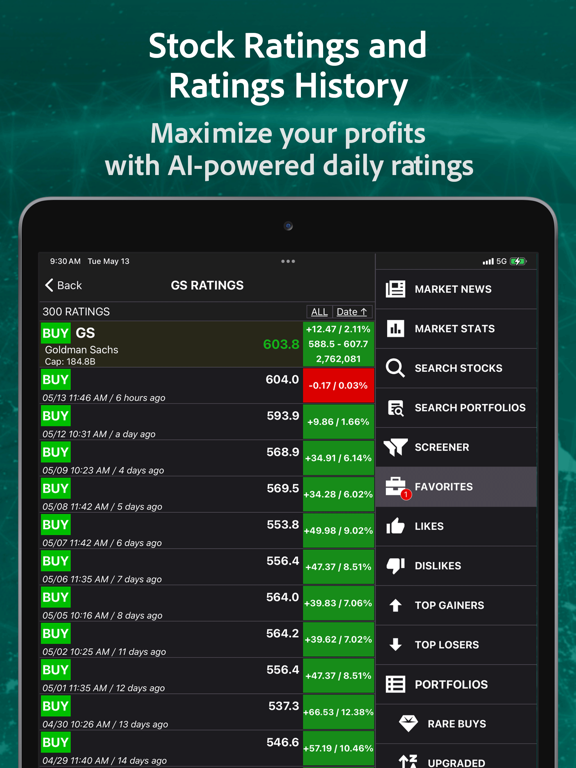
Stock Ratings
• Each stock receives a Grab (Super Buy), Buy, Hold, Sell, or Dump (Super Sell) rating updated daily based on advanced algorithms.
• View the history of ratings over days, weeks, and months to validate the accuracy of app predictions and S&P 500 projections.
• Filter watchlists to see only stocks with Grab or Buy ratings, helping maximize your trading profits.
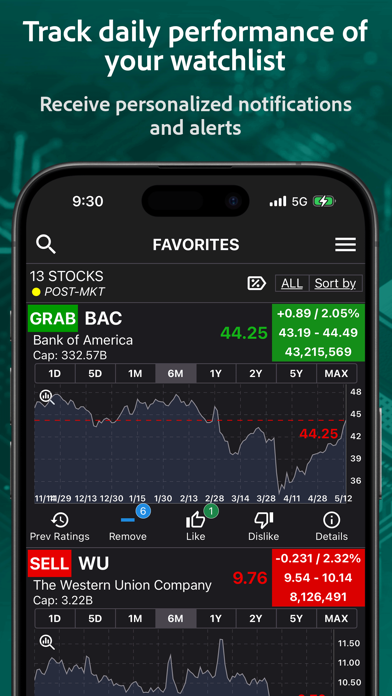
Watchlist
• Add Buy-rated stocks to your watchlist and sort by daily gains, volume, volatility, and other key metrics influenced by s&p 500 index forecast data.
• View price quotes, daily trading range, dollar and percentage price changes, and market capitalization.
• Color-coded sparklines allow effortless tracking of stock performance throughout the day.
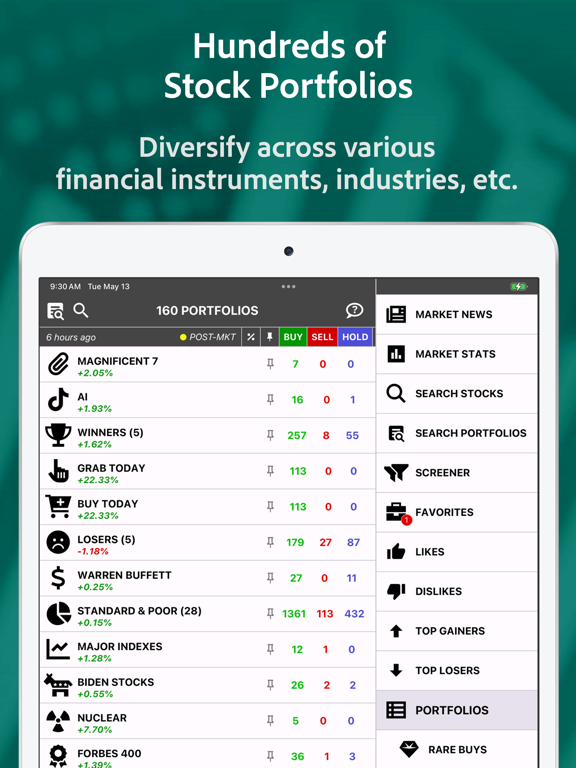
S&P Screener:
• Filter stocks by key metrics: market cap, P/E ratio, EPS, dividend yield, and more.
• Search by sector, performance, volatility, and financial indicators.
• Discover undervalued or outperforming stocks.
• Identify opportunities across all major US stock exchanges.
• Customize screener settings to match your trading strategy.
Charts and Details
• Tap any ticker in your portfolio to access price charts spanning weeks, months, and multiple years.
• Explore company profiles, fundamentals, dividend info, debt, income, volatility, revenue, earnings dates, EPS, and Moving Averages for in-depth analysis.
• Access earnings estimates for S&P 500 stocks to support your investment decisions.
Business News
• Read top stories automatically curated using AI for the latest news on each stock you follow, enhancing your understanding of S&P 500 stock forecast and market outlook.
• Wat