Stock Screener
Stock Screener Summary
Stock Screener is a ad-supported, with in-app purchases Android app in the Finance category, developed by Financept. First released 10 years ago(Apr 2015), the app has accumulated 358.1K+ total installs and 2.7K ratings with a 4.23★ (good) average rating.
Recent activity: 75 installs this week (240 over 4 weeks) showing steady growth , and 2 new ratings this week (2 over 4 weeks) with stable momentum. View trends →
Data tracking: SDKs and third-party integrations were last analyzed on Dec 30, 2025. The app's network data flows (API traffic to/from the app and its SDKs) were last crawled on Dec 30, 2025.
Store info: Last updated on Google Play on Apr 30, 2015 (version 73).
Stock Screener was last scanned for SDKs 2025-12-30. Below is the overview of third party companies detected in the app. The full list of raw SDKs, app permissions and unknown SDKs is available here.
4.23★
Ratings: 2.7K
Screenshots

App Description
Stock Scanner App to filter stocks with technical analysis for US stock market.
Stock Screener app for android is free and searches the US stock market based on technical analysis and stock chart patterns for stock trading. This is a technical stock screener or stock scanner app, not a fundamental stock screener app.
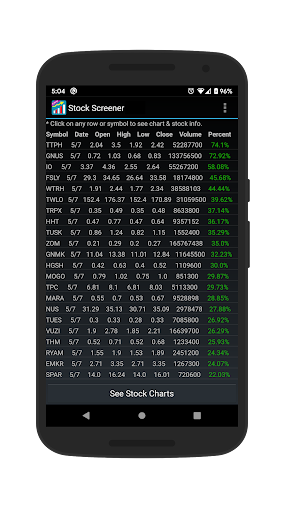
If you do online stock trading, such as swing trading or day trading, you will like this free stock screener app. You can find stocks that you want to trade to your stocks to watch list. This is an end of day technical analysis stock screener, meaning the stock quotes are updated at the end of the day. We do not offer real time stock quotes for our technical stock screener app.
This is one of the best stock scanner app for android, but you need to have a basic understand of how the stock market works in order to utilize this technical analysis app.
This technical stock screener app does not teach you how to trade stocks, nor does it recommend you any stocks to buy. You have to do your own stock market research and buy stocks on your own risk.
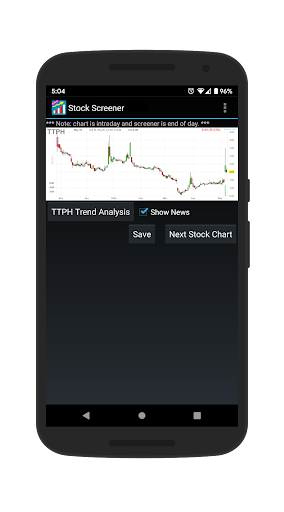
The stock charts within this app are from Finviz. They have copyright to the stock chart. The stock charts uses intraday data which is delay by 15 minutes.
There are many technical indicators that you can scan the stock market for swing trading. You will see stock charts and stock market news for each stock.
This free stock scanner for android scans for stocks based on technical indicators, it does not have any fundamental analysis data like PE ratio. If you are looking for a fundamental stock screener, this stock market app is not for you.
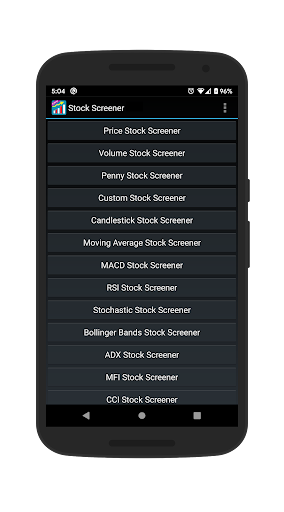
Below is a list of the technical indicators that you can scan with our free stock screener app for android
RSI Stock Screener - RSI Screener find oversold and overbought stocks and stocks with RSI increasing or decreasing.
MACD Stock Screener - Macd Screener search for MACD crossover and bearish macd crossover patterns.
Moving Average Stock Screener - Moving average crossovers generate bullish signal. You can search for both sma crossover and ema crossover stocks.
Daily Stock Gainers and Losers - Get top stock market gainers and losers.
Price Stock Screener - search stocks based on stock prices.
Volume Stock Screener - search stocks base on high volume stocks or stocks with unusual volume.
Penny Stock Screener - search for small cap stocks and penny stocks under $1, stocks under $5, stocks under $10.
Candlestick Stock Screener - candlestick screener allows you to scan for the most popular candlestick patterns.
Bollinger Bands Stock Screener - Bollinger Bands Screener find stocks that are crossing the bollinger bands.
Stochastic Stock Screener - Stochastic can be use as a leading indicator when you use it to find overbought and oversold stocks.
ADX Stock Screener - ADX is a technical indicator to measure the strength of a stock trend without regard to its direction. Our ADX screener gives you the ability to scan for stocks with strong trends.
MFI Stock Screener - is a technical indicator that uses stock price and volume to measure buying and selling pressure. It can also be used to find oversold and overbought stocks.
CCI Stock Screener - identify stock trend or warning of extreme conditions when a stock is overbought or oversold.
William %R Stock Screener - technical indicator to find overbought and oversold stocks.
Force Index Stock Screener - technical indicator that uses stock price and volume to identify strength of a stock trend.
ADL Stock Screener - is a technical indicator to measure the money flow into and out of a stock. It is a similar indicator with the OBV indicator.
ATR Stock Screener - is a technical indicator to measure the volatility of a stock.
Find trade ideas and add to your watch list using our stock scanner. This is one of the best stock screener app android that you can use for free.