EraNorms | Weather vs Before
EraNorms | Weather vs Before Summary
EraNorms | Weather vs Before is a Android app in the Weather category, developed by Yellowsquared. First released recently released ago(Jan 2026),
Store info: Last updated on Google Play on Jan 4, 2026 .
0★
Ratings:
Screenshots


App Description
See how any past day compared to 70 years of climate norms
Is Today's Weather Actually Normal?
You check the temperature, and it feels warmer than it should. The humidity seems off. But you're never sure — is this unusual, or just part of the normal seasonal pattern? EraNorms answers that instantly.
EraNorms compares real-time and historical weather data side-by-side, showing you exactly how today's climate compares to the 70-year average. See temperature anomalies, precipitation patterns, and weather metrics visualized with interactive charts. Understand if you're experiencing truly exceptional weather or just seasonal variation. Explore how El Niño and La Niña patterns influence your local climate.
Why Weather Enthusiasts Love EraNorms
✓ See How Weather Compares to Normal
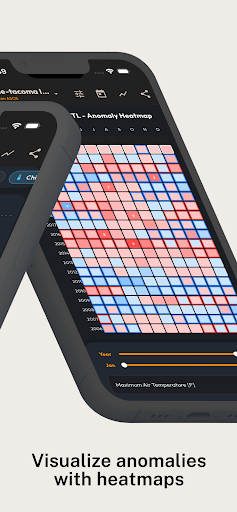
Multiple visualization types show current conditions against 70 years of historical climate norms. Toggle between standard and distribution views, violin charts, and heatmaps to understand weather patterns instantly.
✓ Explore Any Time Period
Slide through decades of data. Compare today to the same date in any year back to 1950. See how climate patterns have shifted over time.
✓ Understand Climate Context
Track El Niño/La Niña (ONI) patterns and how ocean cycles influence your weather. See anomalies calculated from long-term means. Spot warming or cooling trends at a glance.
✓ Control Your View
Filter by month range, individual days, or full years. Select weather variables like temperature, precipitation, humidity, and pressure. Multiple weather stations across regions give you hyperlocal data.
✓ Earn Weather Badges
A unique gamified system highlights extreme weather events. Earn badges for heatwaves, record highs, dry spells, and more. Share your weather achievements with friends.
✓ Interactive Station Maps
Browse weather stations across your region. Switch between locations in seconds. Visual maps help you find the right station for accurate local data from WA_ASOS and other networks.
✓ Share Your Insights
Export and share weather charts as images. Perfect for climate discussions, gardening plans, or understanding local patterns.
Perfect For Everyone
• Scientists & Climate Enthusiasts — Analyze decades of weather data and spot climate trends with statistical tools.
• Gardeners — Know when your region's "normal" frost dates actually occur and plan accordingly.
• Farmers — Track seasonal weather patterns and historical rainfall for crop planning.
• Students — Explore real climate data for projects and research on climate change and weather patterns.
• Weather Geeks — Dig deep into temperature anomalies, precipitation patterns, and statistical distributions.
Deep Dive: What EraNorms Can Do
✓ Compare current weather to 70 years of historical climate norms
✓ Visualize data with multiple chart types: standard charts, distribution/violin plots, heatmaps, and day-view details
✓ Browse weather stations and see hyperlocal climate patterns
✓ Filter by time period, month range, or specific days
✓ Track weather variables: temperature, humidity, precipitation, wind speed, and more
✓ Calculate anomalies and deviations from the mean
✓ Understand El Niño/La Niña influence (ONI Index)
✓ Compute statistics: medians, standard deviations, and ranges
✓ Earn badges for extreme weather events
✓ Export charts and share your weather insights
✓ Customize visualizations and reference years
Know Your Climate
Stop wondering if today is unusually hot or just another summer day. With EraNorms, you'll understand exactly where today's weather fits in the 70-year climate picture — and what global patterns like El Niño might be influencing it.