Vigicrues
Vigicrues Summary
Vigicrues is a Android app in the Weather category, developed by Vigicrues. First released 3 years ago(May 2022), the app has accumulated 83.6K+ total installs
Recent activity: 1.4K installs this week (9.9K over 4 weeks) showing exceptional growth View trends →
Data tracking: SDKs and third-party integrations were last analyzed on Jan 6, 2026.
Store info: Last updated on Google Play on May 10, 2022 (version 2010100).
Vigicrues was last scanned for SDKs 2026-01-06. Below is the overview of third party companies detected in the app. The full list of raw SDKs, app permissions and unknown SDKs is available here.
0★
Ratings: 0
Screenshots

App Description
Vigicrues, the application to be warned of the risk of floods everywhere in France
The Vigicrues application is intended to inform the public of a potential danger linked to floods on the main rivers in France, monitored by the State. This danger is materialized by a color of raw vigilance to which bulletins and forecasts are associated.
This application, managed by the State services, is free and provides the following information:
- raw alertness level (green/yellow/orange/red);
- national and local information bulletins written by flood forecasters, and behavior advice adapted to the situation;
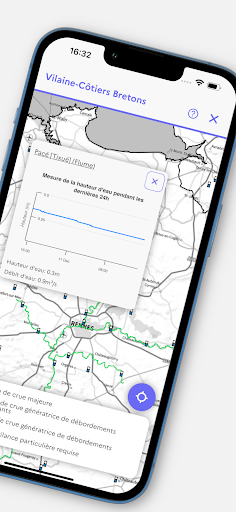
- water levels and/or flows observed in watercourses
- forecasts of water levels and/or flows at certain stations, in a flood situation;
- maps of flood zones in certain sectors.
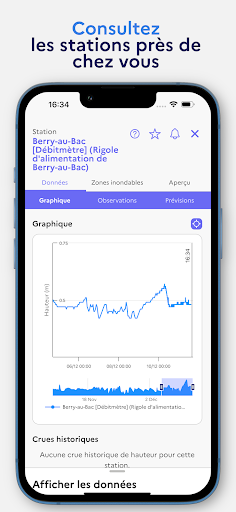
The application makes it possible to geolocate on the map and to visualize the sections of rivers and the stations nearby.
The application also allows you to create a personal account to benefit from personalized subscriptions and warnings.
Subscriptions allow you to receive a notification each time a newsletter is published.
Warnings allow you to receive notifications when there is a change in the color of flood vigilance on a section of watercourse, a territory, or a department; and to receive notifications when the level of the stream exceeds the threshold chosen by the user on a station.
*** New arrivals ***
The application makes it possible to geolocate on the map and to visualize the sections of rivers and the stations nearby.
For stations selected as favourites, the value of the last measurement is displayed.
Improvements to the following:
- selection of a course section or a station on the map
- adding a station favorite from a station file
- readability of the map on the home page
- entity search tool
- tooltip showing the measured value on the hydrographs