タイドグラフBI / 4,000ヶ所の釣り場に対応した潮見表
タイドグラフBI / 4,000ヶ所の釣り場に対応した潮見表 Summary
タイドグラフBI / 4,000ヶ所の釣り場に対応した潮見表 is a ad-supported, with in-app purchases Android app in the Weather category, developed by B.Creation株式会社. the app has accumulated 465.6K+ total installs
Recent activity: 592 installs this week (4K over 4 weeks) showing below average growth View trends →
Data tracking: SDKs and third-party integrations were last analyzed on Feb 5, 2026. The app's network data flows (API traffic to/from the app and its SDKs) were last crawled on Jun 9, 2025.
Store info: Currentversion 197.
タイドグラフBI / 4,000ヶ所の釣り場に対応した潮見表 was last scanned for SDKs 2026-02-05. Below is the overview of third party companies detected in the app. The full list of raw SDKs, app permissions and unknown SDKs is available here.
0★
Ratings:
Screenshots

App Description
The industry's first tide table app that supports 4,000 fishing spots! This is an app that allows you to see not only tidal information, weather, wind, waves, and barometric pressure, but also the time you can fish on one screen.
Tide Graph BI is a tide table app that can display pinpoint tide tables (tide graphs) for 4,000 fishing spots across Japan, tide-related information, weather, temperature, rainfall, wind direction and speed, wave height, air pressure, water temperature, lunar calendar, and other information necessary for fishing. The point is that 4,000 fishing spots where fish are actually caught were selected based on the fishing results data of anglers.
It is useful not only for "fishing" but also for sea leisure activities such as "surfing", "diving" and "shellfish digging"!
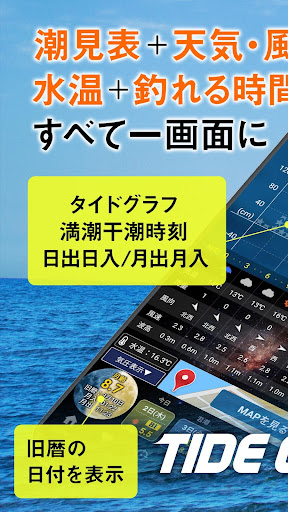
■Tide table + weather + fishing time all on one screen
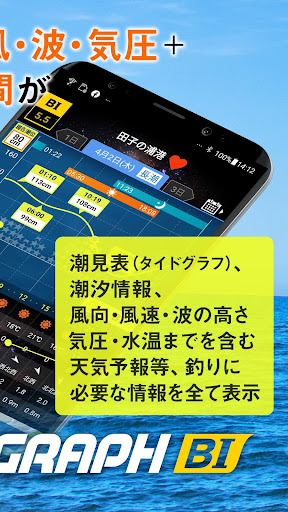
All information necessary for fishing is displayed on one screen, including tide tables (tide graphs), tide information, wind direction and speed, wave height, weather forecast including air pressure, water temperature, lunar calendar, etc. By displaying the tide graph and weather forecast on the same screen, Tide Graph BI has significantly increased the amount of information that can be checked at once.
■Industry first! All 4,000 fishing spots! Display highly accurate weather forecasts
Tide Graph BI allows you to see pinpoint tide tables and weather forecasts for 4,000 locations where people have actually caught fish, such as ports and sea fishing parks. The weather forecast is not a forecast for each prefecture, but a pinpoint forecast for the fishing spot. If you can check the "weather, temperature, rainfall, wind direction/speed, wave height, air pressure, and water temperature" for each fishing spot, you can have a more fulfilling fishing trip. We plan to add more points regularly in the future, so please look forward to it.
■Displays the lunar calendar, which is highly relevant to fishing results
Tide Graph BI displays the lunar calendar, which is highly relevant to fishing results. The lunar calendar is a calendar based on the trajectory of the moon. Since the rhythm of the tides is influenced by the phases of the moon, some fishermen and anglers consider fishing dates based on the lunar calendar. The lunar calendar, which has been requested by many such people, can now be viewed in the app along with the tide graph.
■Displays the "BI (Blast Fishing Index)" that shows how easy it is to catch fish
BI (Blast Fishing Index) is a numerical value that indicates how easy it is to catch fish, and the higher the number, the easier it is to catch fish. In the tide graph, the BI is shown by a number and the number of stars.
BI is a unique know-how that quantifies all factors related to fish feeding activity, such as tides and multiple natural conditions, and past fishing data, to derive the ease of catching fish every hour. Since it takes into account the natural conditions of each point, you can pinpoint the ease of catching fish in detail.
■Ultimate design with a focus on ease of use
Tide graph BI was created in pursuit of the most easy-to-read form of abundant information related to fishing. In addition to the tide table, all the information necessary for fishing, such as wind direction, wind speed, wave height, air pressure, water temperature, and the lunar calendar, can be instantly checked at a glance, and it is designed to be intuitive to operate.
■Notification function that gives peace of mind even at the fishing spot
In addition to the tide table, Tide graph BI displays detailed information on earthquakes, tsunamis, and typhoons in real time. You can also check the waves and high tides that are of concern when fishing at sea. When the latest information is updated, a red badge will notify you, so you can enjoy fishing safely.
■The state of the rain clouds at the fishing spot is clear at a glance!
You can check the movement of clouds in real time with the rain cloud radar. You can check the movement of rain clouds up to 60 minutes ahead every 10 minutes. You can easily see the state of rain clouds at your current location and the fishing spot you are heading to in the app, so you won't miss the timing when it is easier to catch fish, such as after a light rain.
■Notes
The tide tables and weather information published in this app are not provided for navigation, so please do not use it for navigation. In addition, please note that we are not responsible for any damage caused by the use of all the information published, regardless of the purpose of use.
■About Tide Graph Supporter
You can use the following services for 190 yen per month.
① You can freely view the "tide graph from the next month onwards" and the "tide graph from 30 days ago or more ago" at any time.
② Ads in the app will be hidden.
*Some important notifications may be displayed.
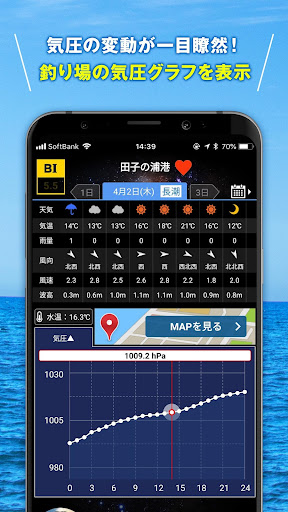
③You can view the barometric pressure graph from the day after tomorrow onwards at any time.
*Barometric pressure graphs will be available for up to 6 days from the current day.
③The maximum number of My Points that can be registered is 50.
*The normal maximum number of points is 10.
■Check the tide graph instantly on your smartwatch!
You can view the tide graph for the day of the top point displayed on the My Points screen of the smartphone app on Wear OS-compatible smartwatches, including the Pixel Watch series.
You can easily use Tide Graph BI by using complications on Wear OS.
Terms of Use: https://tide.chowari.jp/app/rule.html
[Support]
If you have any questions, problems, or requests, please contact us at the address below.
tide@bcreation.jp