Stock Screener Pro - Technical
Stock Screener Pro - Technical Summary
Stock Screener Pro - Technical is a mobile iOS app in Finance by Qiting Huang. Released in Dec 2015 (10 years ago). It has 44 ratings with a 4.20★ (good) average. Based on AppGoblin estimates, it reaches roughly 437 monthly active users . Store metadata: updated May 1, 2022.
Store info: Last updated on App Store on May 1, 2022 .
4.2★
Ratings: 44
Screenshots

App Description
Stock screener pro allows you to combine multiple technical indicators and scan.
This is the PRO version of our free stock screener app. It has all the features that the free version has. The differences in this PRO version is
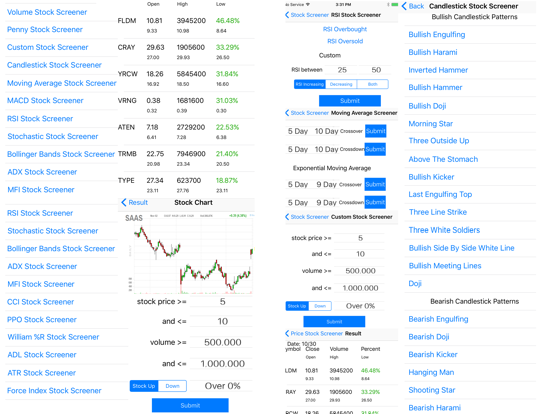
1. The Stock Screener Pro allows you to combine multiple technical indicators and scan the stock market. This will save you a lot of time as you no longer need to scan technical indicator one by one. For example, you can search for stocks trading in the range of $5-$10 with volume 100,000-1,000,000 that formed a bullish engulfing pattern and a macd crossover with one shot. It takes only a few seconds to get you the result sets you desired.
2. Removed Ads
Stock Screener search US stock market based on technical indicators which allows you to find trade setups to swing trade. This is an End of Day Technical Stock Screener, meaning the stock quote data is updated at the end of the day. We do not offer real time stock quotes for our stock screener. If you are a day trader, this app might not be useful. However, if you are a short term swing trader, you will find this stock screener app useful.
There are a variety of technical indicators that you can scan the stock market for trading setups.
You will find stocks to watch with our stock market screener.
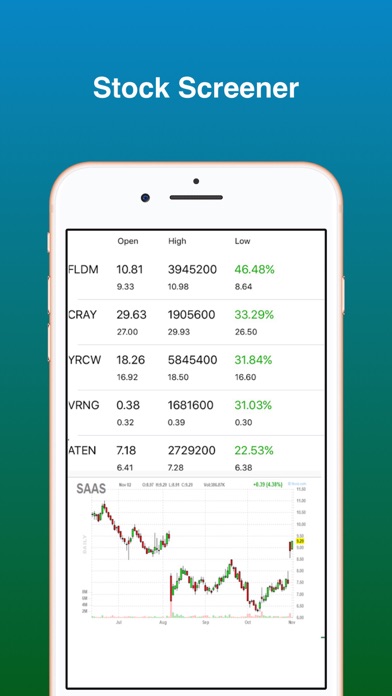
Our stock screener uses stock charts from Finviz. The stock charts uses intraday data which is delay by 15 minutes.
This stock scanner scans for stocks based on technical indicators only, it does not care about the fundamental data like PE ratio. If you are looking for a fundamental stock screener, this app is not for you.
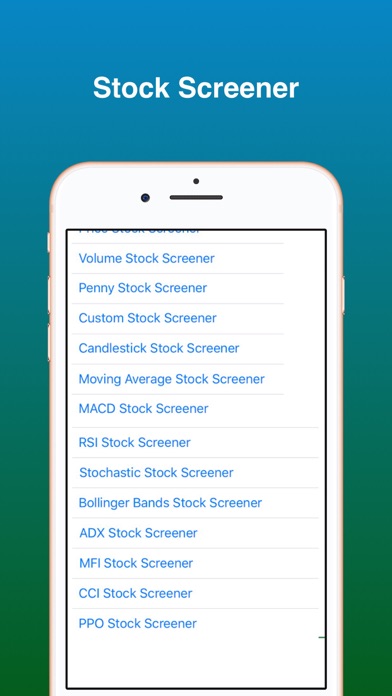
Below is a list of the most popular stock chart patterns and technical indicators that you can use with our stock screener app.
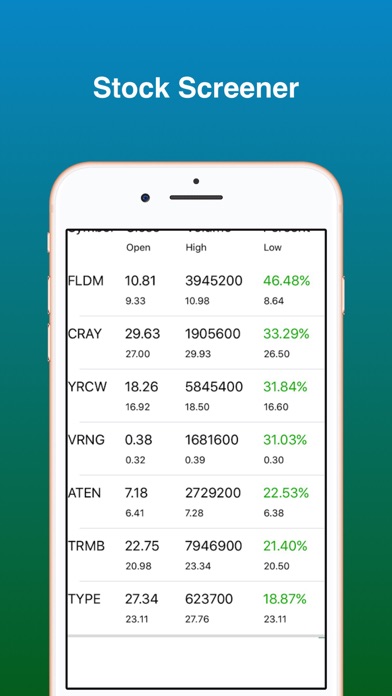
Daily Stock Gainers and Losers - You can find daily stock gainers and losers
Price Stock Screener - allows you to search for stocks based on price.
Volume Stock Screener - allows you to search for stocks based on volume moment.
Penny Stock Screener - allows you to search for small cap stocks as well as penny stocks listed on NYSE, NASDAQ and AMEX.
MACD Stock Screener - MACD is a popular technical indicator that are widely used by swing traders. Our MACD stock screener allows you to scan for MACD crossover, cross down patterns.
Candlestick Stock Screener - Our candlestick stock screener allows you to scan for the most popular candles