Taculator 84 Graphing Calc
Taculator 84 Graphing Calc Summary
Taculator 84 Graphing Calc is a with in-app purchases iOS app in Education by Di Venisco UG (haftungsbeschrankt). Released in May 2019 (7 years ago). It has 10.3K ratings with a 4.45★ (good) average. Based on AppGoblin estimates, it reaches roughly 9.2K monthly active users and generates around $<10K monthly revenue (100% IAP / 0% ads). Store last updated May 25, 2026
Recent activity: -2 new ratings this week View trends →
Taculator 84 Graphing Calc SDKs Summary
App not yet scanned for SDKs.
4.45★
Ratings: 10.3K
Screenshots


App Description
Intended for use with TI-84 Plus.
TACULATOR 84 GRAPHING CALCULATOR
• Your graphing calculator for high school and college students.
• Includes all the commands and functions for advanced math, list, statistics, distribution, stat plots, etc.
• Use the arrow keys or your fingers to navigate inside the app.
• Covers everything you need: Pre-Algebra, Algebra 1 & 2, Pre-Calculus, Calculus, Statistics...
IT'S EVEN BETTER THAN AN ACTUAL CALCULATOR
• Taculator is 100X faster as it uses the huge calculation power of your iPhone/iPad, while handheld calculators are often slow.
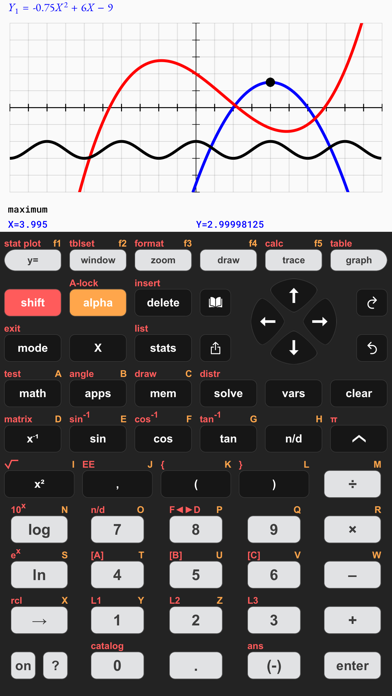
• High-resolution graphing window: Make sharp and beautiful graphs.
• Your new calculator weighs nothing and is always ready on your phone.
• Share your calculations with friends as a text message or email.
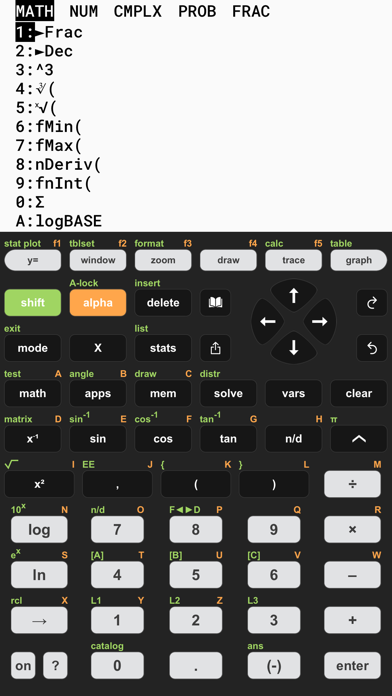
◉ Math Functions
• Scientific calculator with all basic arithmetic and advanced functions.
• Ability to scroll through history and copy previous calculations.
• Complex numbers support
• Probability functions like nPr, nCr, factorial, random numbers.
• Enter fractions easily.
• Convert angles and use DMS format.
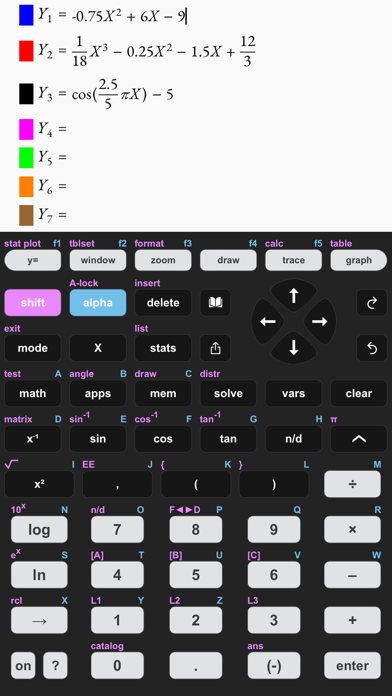
◉ Graphing Functions
• Graph every function you want and trace for X- and Y-values
• Calculate intersection, zero, minimum, maximum, integral, and derivative.
• Switch between full-screen graphs and normal mode.
• Zoom in and out with your fingers and adjust the window settings.
• Graph statistical plots like histogram, box plot, scatter plot, xy-line plot
• Draw vertical, horizontal, tangent, circle.
◉ Matrix Calculator
• Store matrices and reuse them using shortcuts like [A], [B], [C],...
• Do matrix arithmetic operations: Scalar multiplication, addition & subtraction, multiplication, power of a matrix.
• Calculate transpose, determinant, dimension, inverse matrix, row echelon form, reduced row echelon form, identity matrix, cumulated sum.
◉ List, Statistics, and Distribution
• Use the stat list editor to enter your list values.
• Perform 1- and 2-Variable statistics.
• Use lists to calculate min, max, mean, median, sum, product, standard deviation, variance.
• Find best-fit regressions: LinReg (ax+b), LinReg (a+bx), QuadReg, CubicReg, QuartReg, LnReg, ExpReg, PwrReg, Logistic, SinReg.
• Perform statistical tests: Z-Test, T-Test, 2-SampleZTest, 2-SampleTTest, 1-PropZTest, 2-PropZTest, ZInterval, TInterval, 2