Art of Stat: Regression
Art of Stat: Regression Summary
Art of Stat: Regression is a with in-app purchases iOS app in Education by Bernhard Klingenberg. Released in Mar 2022 (4 years ago). It has 25 ratings with a 4.68★ (excellent) average. Based on AppGoblin estimates, it reaches roughly 38 monthly active users and generates around $<10K monthly revenue (100% IAP / 0% ads). Store last updated Feb 6, 2026
Art of Stat: Regression SDKs Summary
App not yet scanned for SDKs.
4.68★
Ratings: 25
Screenshots


App Description
News: The Regression app is now part of the all new "Art of Stat" app, which contains the Regression and seven other modules.
Please consider getting the Art of Stat app for the latest updates and features from the App Store. Simply search for "Art of Stat" on the App Store. This app will continue to work, but future development is concentrated on the new Art of Stat app.
Original Description:
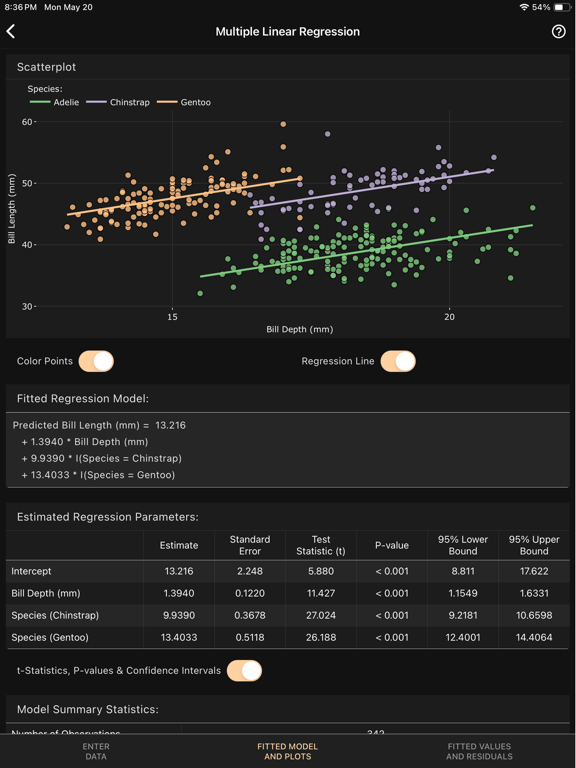
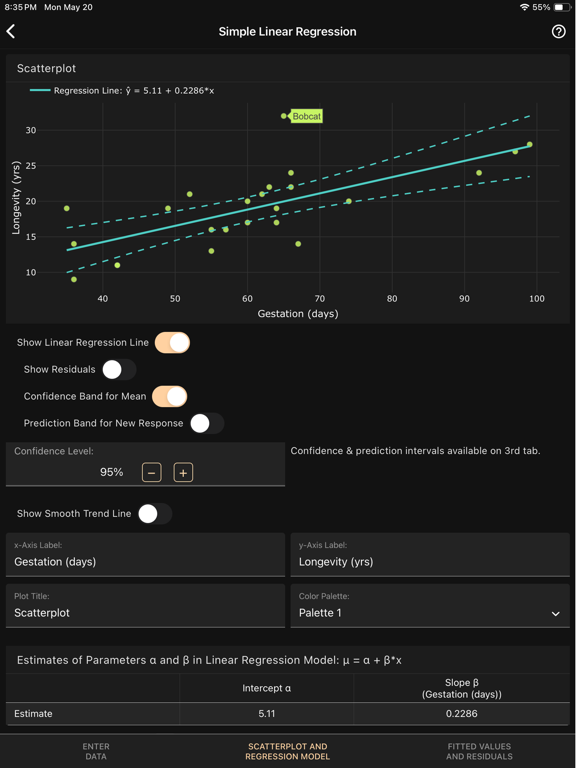
The Art of Stat: Regression app creates scatterplots, fits linear, logistic, Poisson or exponential regression models, and displays inference for model parameters (standard errors, confidence intervals, P-values).
The app now also fits multiple linear and logistic regression models and allows including categorical predictors and two-way interactions!
The app computes and displays confidence intervals for the mean response and prediction intervals for a future response. The fitted model and the intervals are visualized on the scatterplot, and you can obtain and plot raw and standardized residuals.
You can color points on the scatterplot according to a third quantitative or categorical variable to reveal additional patterns.
For data entry, you can enter your own data via the new Data Editor app, import a CSV file, or choose from several pre-loaded example datasets.
Features:
- Scatterplot Matrix to study pairwise relationships
- Display the fitted regression equation on the scatterplot, even when including (and additional) categorical predictor
- Table with all regression coefficients and their inferences (P-values, confidence intervals)
- Summary statistics such has R^2, R^2-adjusted and maximized Log-Likelihood
- Fitted values and (standardized) residuals (which you can download)
- Predictions for your own values of the explanatory variables
- Residual plot to check assumptions and for outliers