SPL Graph
SPL Graph Summary
SPL Graph is a with in-app purchases iOS app in Music And Audio by Andrew Smith. Released in Mar 2009 (17 years ago). It has 7.00 ratings with a 4.14★ (good) average. Based on AppGoblin estimates, it reaches roughly 20 monthly active users and generates around $<10K monthly revenue (100% IAP / 0% ads). Store metadata: updated Dec 20, 2025.
Store info: Last updated on App Store on Dec 20, 2025 .
4.14★
Ratings: 7.00
Screenshots


App Description
SPL Graph is an audio Sound Pressure Level (SPL) environmental noise analyzer, real-time frequency analyzer, chart recorder and data logger. It includes:
* Plot sound level over time
* Record audio while plot is running, playback to identify sounds that may have caused problems
* Capture video of events (optional in-app purchase)
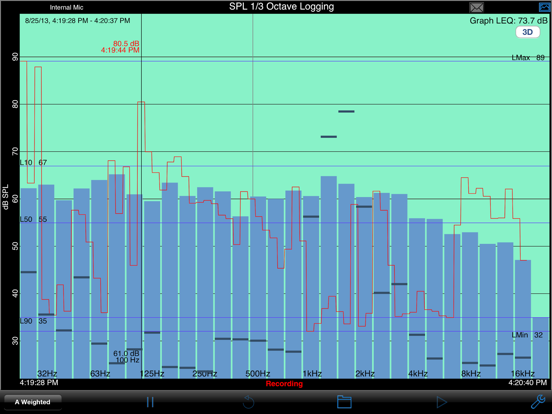
* Do octave and 1/3 octave band analysis (optional in-app purchase)
* Show a 3D Plot of octave or 1/3 octave results
* Calculate Ln SPL values, L01, L10, L50, L90, L95, LMax and LMin
* Email notifications when sound exceeds pre-set limits
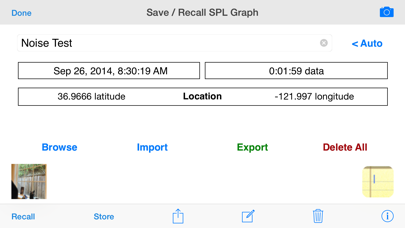
* Auto-save results after set intervals, and email the results to you
* Start another plot after auto-saving for continuous operation
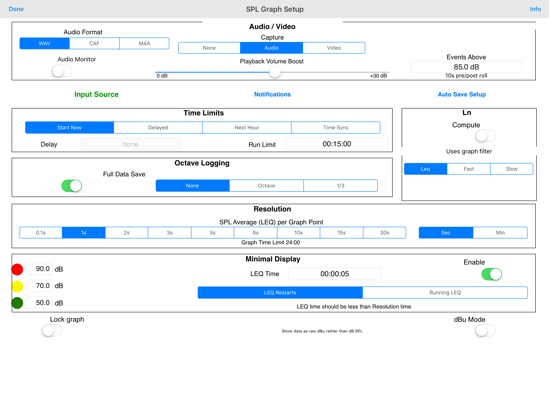
SPL Graph works by averaging the SPL for a period of time that can vary from 0.1 second to 60 minutes, applying an optional weighting filter, and plotting the sound level, recording the raw audio signal, if recording is turned on.
For sound intervals of 1.0 second to 60 minutes, the optional octave and 1/3 octave logging modules allows storing the spectrum of the sound, for each interval.
The app works very well with the built-in iOS device microphone. To upgrade the app to true professional standards, add our iTestMic, iPrecisionMic, or iAudioInterface2 with an appropriate microphone, and get ANSI or ISO Type 1 or 2 results. With iPrecisionMic, you can send the system in to our calibration lab and get a calibration certificate for ISO 61672 and ANSI S1.4.
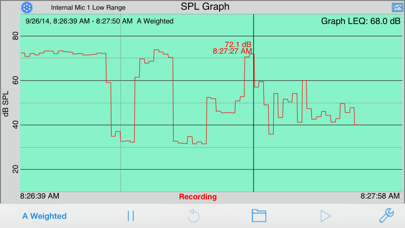
SPL Graph can record up to 24 hours of sound level data, with single second resolution. The graph starts with a one-minute plot window, and as a minute is recorded, the graph re-scales automatically and adds another minute to show the data collected so far. The overall SPL level, or LEQ, is displayed for whatever portion of the test is showing on the graph.
Tap the play button to play back the recorded audio, and you can use the cursor to scrub the audio location on the graph. Use this feature to listen to events that you can see on the graph.
With the optional octave logging module, you can also record the octave or 1/3 octave band levels. And, you can view the data on the 3D plot for a graphical view of frequency over time.
You can scroll and scale the graph vertically, in dB, by using standard swipe and pinch gestures. You can also scroll and expand and contract the time axis using gestures. Zoom out to