Economy
Economy Summary
Economy is a with in-app purchases iOS app in Finance by Cascade Software Corporation. Released in Jul 2009 (16 years ago). It has 163 ratings with a 4.61★ (excellent) average. Based on AppGoblin estimates, it reaches roughly 1.7K monthly active users and generates around $<10K monthly revenue (100% IAP / 0% ads). Store metadata: updated Sep 24, 2024.
Store info: Last updated on App Store on Sep 24, 2024 .
4.61★
Ratings: 163
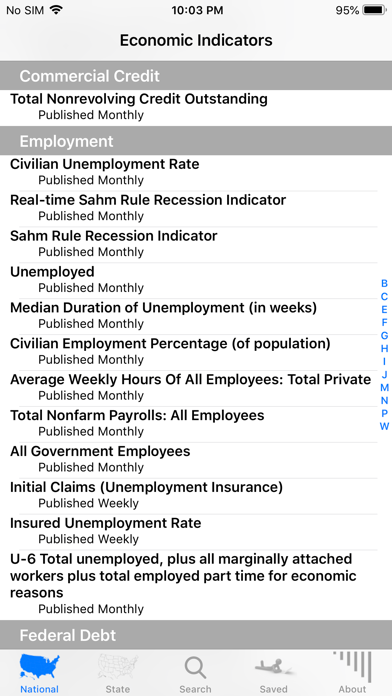
Screenshots


App Description
***** Featured in iTunes "STAFF FAVORITES" section and also #1 Finance app for several weeks in 2009 *****
***** Featured on cover and chapter-5 of Wiley Publishing's book on Incredible iPhone Apps *****
This app gives you a snapshot of the US economy by providing the latest key economic indicators and tracking the history of these indicators across the past few months, years and decades.
The app includes around 45,000 economic indicators. The primary focus is on US economic indicators (including detailed data on all 50 states and for major metro areas).
It also includes some economic indicators for more than a 100 other countries (e.g. UK, Canada, Australia, India, Singapore, China, Mexico, Estonia, Kenya, Nepal, Brazil etc.)
Macworld review for the V1 version of the app http://www.macworld.com/article/142855/2009/09/economicnewsapps.html says
"tough to do better than Cascade Software’s Economy app"
"The app is a one-stop shop ....... economists and financial analysts love to parse"
"it’s a handy resource to have available in the palm of your hand."
---
Features:
1. Latest values of key (curated) US economic indicators (GDP, Employment, Housing, Manufacturing, Inflation, Trade Deficit, weekly updates of Canadian,Mexican currency exchange rates , M2 Money stock, etc.) published by the US Federal Reserve.
2. Share economic graphs through social media, email, SMS, printouts etc.
3. Graphs to track economic indicators across many different time ranges (e.g. 1 year, 3 years, ...,40 years etc.)
4. Graphs that track the values of economic indicators across Democratic and Republican presidencies and across Recession periods over the past several decades.
5. Around 45,000 economic indicators (mostly for the US, but also for more than a 100 other countries)
6. A powerful search engine that makes it easy to use partial (or full) keywords to search through the 45,000 economic indicators provided by the app.
7. All indicators updated soon after the govt numbers are published. (Most indicators updated monthly, others quarterly, annually, daily or weekly)
8. Help/Descriptions for many economic indicators.
9. Data-value transformations (graphs can be charted on interesting y-axis transformations (e.g. continuously compounded annual rate of change, natural log, change from previous year etc.)
10. The app requires int