Vvidget
Vvidget Summary
Vvidget is a mobile iOS app in Productivity by VVIMAGING, INC.. Released in May 2010 (16 years ago). It has 2.00 ratings with a 5.00★ (excellent) average. Based on AppGoblin estimates, it reaches roughly 6.00 monthly active users . Store last updated Apr 7, 2026
Vvidget SDKs Summary
App not yet scanned for SDKs.
5★
Ratings: 2.00
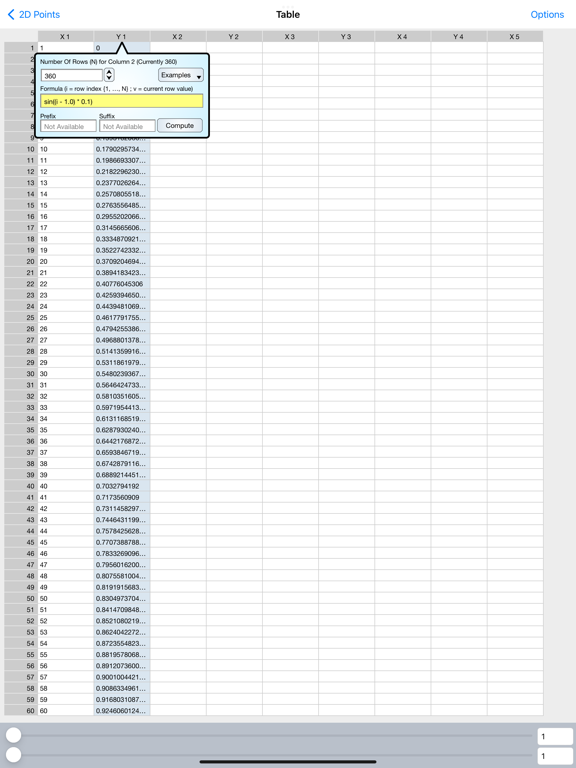
Screenshots

App Description
Vvidget is straightforward:
• Makes graphs from numbers.
• Made by the data visualization expert - VVI®.
• Touch-hold a graph to email, print or save to your Photo Album.
• Plenty of built-in options.
• AirDrop your graph to the most powerful data visualization application on the iPad, Graph IDE.
This Vvidget application is the same as the popular Graph application (also available on the App Store) except there is no additional in-app purchase.
WHAT IS A VVIDGET?
Vvidget is pronounced with only one "V" as in vijit. When you put the two Vs together they look like a W as in Widget. Vvidget makes widgets specific to graphical data reporting (information visualization). The three leading characters in Vvidget are VVI and VVI is the author of Vvidget. In a nutshell, "Vvidgets are widgets made by VVI".
The popular Graph application for iPad, iPhone, Mac (also available on the App Stores), the preeminent Graph IDE application for iPad, iPhone, Mac and the Web and this Vvidget application are based upon the Vvidget Codebase. You may download or use any of those applications to see the power of Vvidget. Vvidget expressions include forms-based HTTP SOA API to native Framework API. Very powerful and can be used out of the box by graphic artists and integrated into web-based dashboards as either a service or collocated. Not just the normal stuff, but also the stuff that makes your enterprise unique.
FEATURES
• Includes several 1D, 2D and 3D graph types such as bar, column, pie, line, area, scatter, 3D perspective scatter, trajectory and surface, volumetric, z-sliced cell, maps, linear, semi-log, x-log, log-log, polar, r-log, Gregorian date and many variations.
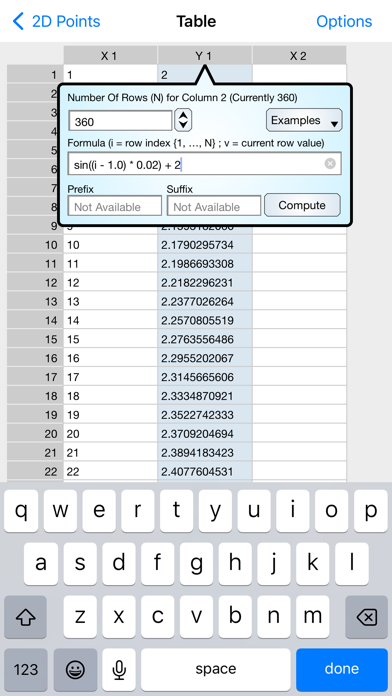
• Data is pasted from the pasteboard, fetched from web servers and inserted and edited using a table interface.
• Touch-hold a graph to export it to Graph IDE on the iPad. Graph IDE is the most powerful data visualization application for the iPad and gives access to a wide variety of graph types and graphical effects. (Graph IDE is separately available for the iPad).
• Touch graphs to rotate, zoom, scroll and scan data.
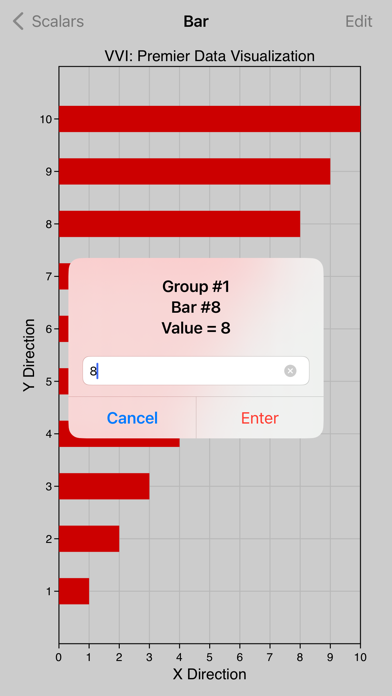
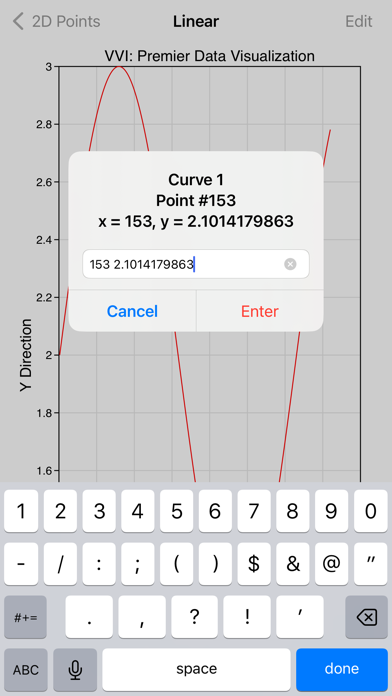
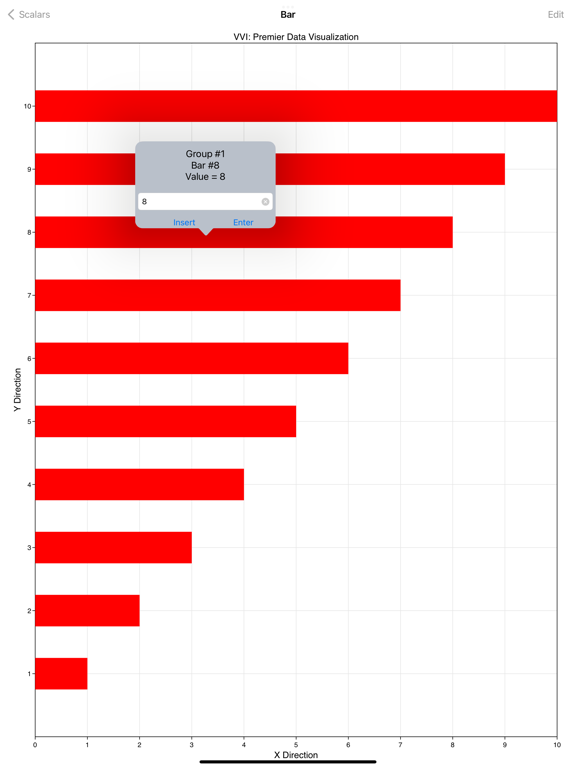
• Touch data graphics, such as lines and bars, to show data values.
• Touch-hold a graph to copy, print, mail, AirDrop and save it to other applications.
• Data and preferences are organized by project and each project is persistent and automatically saved so you can