PANARAY Mobile
PANARAY Mobile Summary
PANARAY Mobile is a mobile iOS app in Finance by William O'Neil & Co. Inc.. Released in Feb 2012 (14 years ago). It has 9.00 ratings with a 3.67★ (average) average. Based on AppGoblin estimates, it reaches roughly 52 monthly active users . Store metadata: updated Dec 16, 2025.
Store info: Last updated on App Store on Dec 16, 2025 .
3.67★
Ratings: 9.00
Screenshots


App Description
PANARAY® Mobile is a global equity research platform designed exclusively for institutional investors. It's highly visual workspace translates dense blocks of data into graphics to help money managers spot opportunities with efficiency.
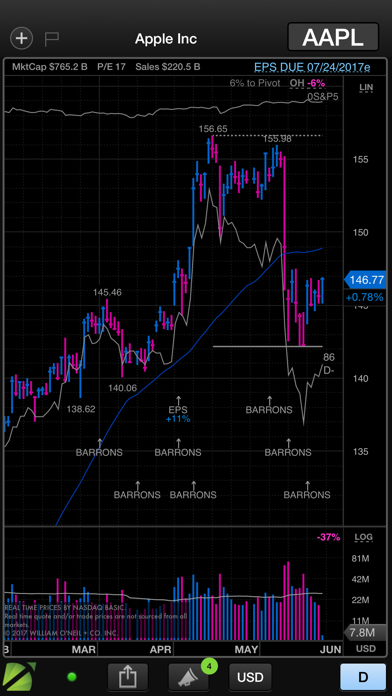
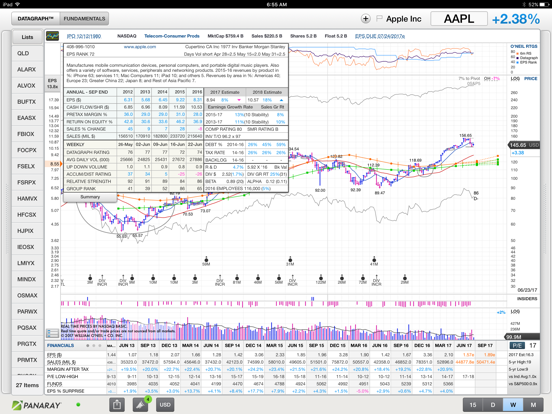
The Symbol view uses our Datagraph™ format, which combines the most essential technical and fundamental equity data in one view. This format takes on an array of advanced capabilities in PANARAY that are not available on any other kind of stock chart.
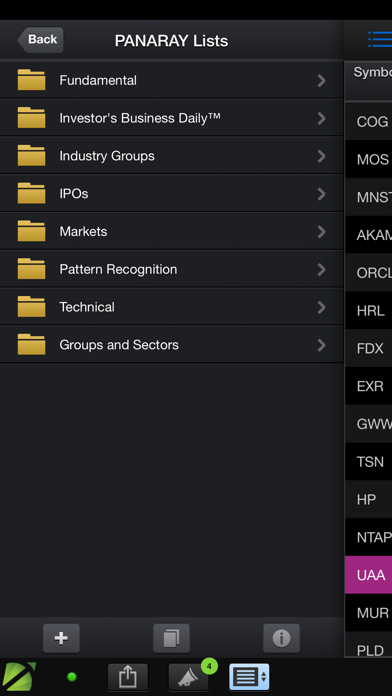
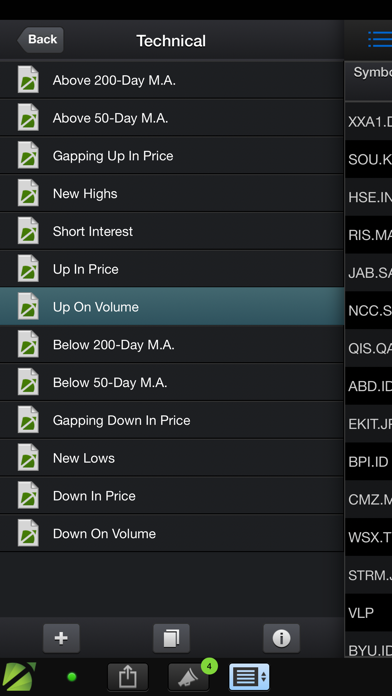
The Lists view offers an organizational hub that allows money managers to sort and filter lists of equities based on handpicked criteria.
In the Groups view money managers can anticipate and monitor changes in sectors globally, with a Rotation Graph that confirms existing trends and illuminates emerging ones, worldwide or by select geography.
With PANARAY Mobile, institutional investors can:
• Access industry-leading stock charts with a wide range of fundamental and technical data points you can customize
• View deep fundamentals in a sliding tab that includes a company’s current and historical financial statements, such as income statement, balance sheet, cash flow statement, and ratios report
• See sectors, industry groups, or equities plotted on an animated Rotation Graph that presents a six-week visualization of performance trends across various geographic regions and countries
• See three sets of forward estimates as part of the earnings line, with an animated “rewind” of past earnings performance to speed analysis
• Evaluate margin expansion using the revenue line to creates an overlay of revenue-per-share and earnings-per-share data
• Strengthen buy and sell decisions using pattern recognition, which visually highlights classic chart patterns that signal key technical activity in a stock
• Review the extent of buying and selling within a company on the insider transactions line and see its effect on price and volume
• Manage lists (create, duplicate, rename, mark as a favorite, share) and edit list contents
• Find new investment ideas from an array of PANARAY Lists, some of which are global theme lists curated by O’Neil Equity Research
• Use NASDAQ Basic real-time prices for U.S. equities
• Tap and hold on the Datagraph to reveal the Track Price tool, which displays price, volume, and pattern recognition details
• Email, print vi