Stock+: Stock Market Heat Map
Stock+: Stock Market Heat Map Summary
Stock+: Stock Market Heat Map is a ad-supported, with in-app purchases iOS app in Finance by Kemal Bakacak. Released in Jan 2024 (2 years ago). It has 84 ratings with a 4.39★ (good) average. Based on AppGoblin estimates, it reaches roughly 636 monthly active users and generates around $<10K monthly revenue (33% IAP / 67% ads). Store metadata: updated Jun 20, 2026, version 85.
Data tracking: SDKs and third-party integrations were last analyzed on Jun 9, 2026.
Store info: Last updated on App Store on Jun 20, 2026 (version 85).
SDKs, Trackers & Permissions
Stock+: Stock Market Heat Map was last scanned for SDKs 2026-06-09. Below is the overview of third party companies detected in the app. The full list of raw SDKs, app permissions and unknown SDKs is available here.
AppGoblin saw Stock+: Stock Market Heat Map uses 2 Analytics: Product
AppGoblin saw Stock+: Stock Market Heat Map uses 2 Ad Networks
AppGoblin saw Stock+: Stock Market Heat Map uses 1 Business Tools
AppGoblin saw Stock+: Stock Market Heat Map uses 2 Development Tools
App Details
App Store
Ads & App-Ads.txt
AppGoblin SDK Scans
4.39★
Ratings: 84
Screenshots


App Description
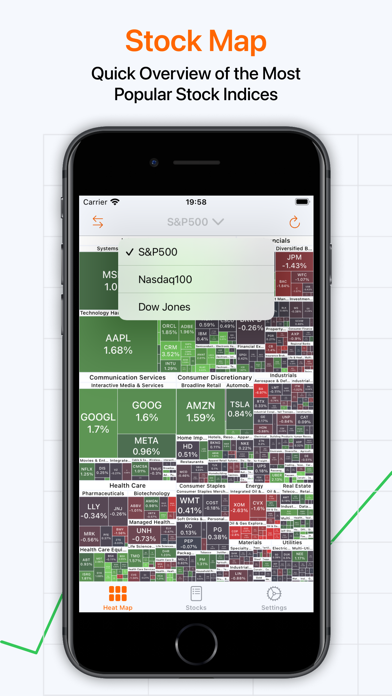
Welcome to Stock+, where your financial aspirations take flight. The most popular stock indexes are in your fingers. Explore the stocks sector by sector with interactive visualized map. Look at S&P500, Dow Jones and Nasdaq 100 stock map (heat map, treemap). Whether you're a seasoned investor or just starting on your financial journey, Stock+ is your trusted partner in building a secure and prosperous future.
Features,
- Interactive Stock Map
Easily understand with color-coded according to daily results.
- Deepdive Sector Stocks
Lots of stock in a screen. Click to any sector and new map will draw with that sector stocks. Easy to use and more understandable especially in large number of stock based indexes like S&P 500.
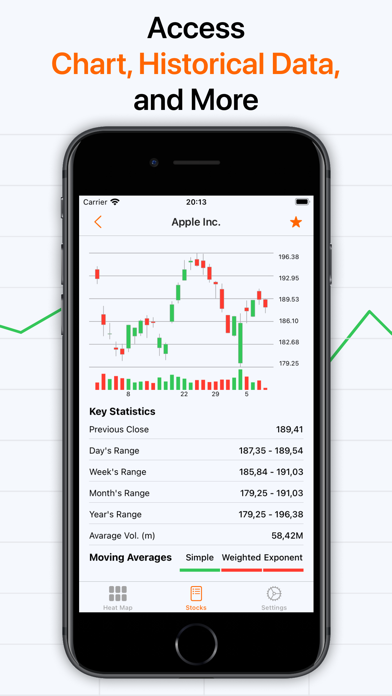
- Stock Detail
Choose the whatever you want stock and get more price information like well-designed candlestick graphic, daily, weekly, monthly, yearly minimum and maximum price movements.
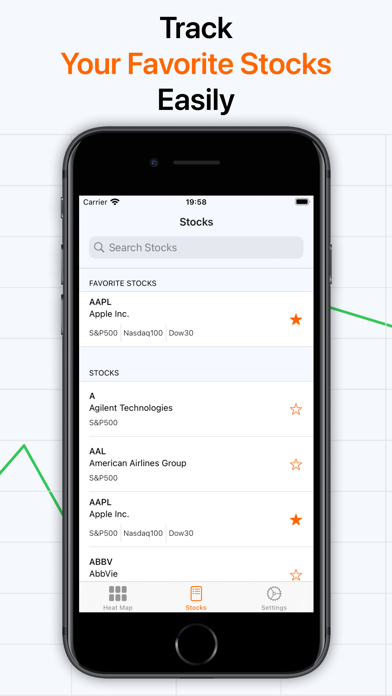
- Favorite Stocks
Add all of your favorite stocks to list and you can easily access with them. The new list will start with your favorite stocks.
- Reliable and Secure
Your privacy and security are our utmost priority. Your favorites are kept in your phone. Holdings are transferred to our database and kept encrypted.
- User-Friendly Interface
Navigate the complexities of investing with ease. Our intuitive interface ensures that you can monitor your investments, track performance, and make informed decisions—all from the palm of your hand.
- Technical Analysis
Follow simple, weighted, exponential daily moving averages in 5, 10, 20, 50, 100, 200 day periods.
- Technical Indicators
Also follow best resulted indicators like RSI, MACD, STOCH, CCI, STOCHRSI, ATR, ADX, OU, ROC, WilliamsR and get easily signals.
- Stock Holdings
How to Work?
The stocks on a map are grouped in hierarchies. A market contains multiple sectors. A sector contains multiple industries. An industry contains multiple stocks.
For example, S&P500 index has 11 sectors (Utilities, Real Estate, Materials, Information Technology, Industrials, Health Care, Financials, Energy, Consumer Staples, Consumer Discretionary, Communication Services). All of sectors can have lots of different industries. Utilities is one of sectors and has 5 different industries (Independent Power Producers & Energy Traders, Electric Utilities, Multi-Utilities, Water Utilities, Gas Utilities). Each utilies has o