AI Chart Analysis - Chartby

AI Chart Analysis - Chartby Summary
AI Chart Analysis - Chartby is a free, ad-supported, with in-app purchases iOS app in Books And Reference by Pixoby. Released in Dec 2024 (1 year ago). It has 24 ratings with a 4.58★ (excellent) average. Based on AppGoblin estimates, it reaches roughly 93 monthly active users and generates around $<10K monthly revenue (22% IAP / 78% ads). Store last updated Jul 15, 2026
AI Chart Analysis - Chartby SDKs Summary
App not yet scanned for SDKs.
4.58★
Ratings: 24
Screenshots


App Description
Turn any chart into a clear, structured read in seconds. Chartby is an AI chart analysis and trading-education app: upload a screenshot of any stock, crypto, or forex chart and get an instant, easy-to-follow breakdown, so you can learn to read the markets like an experienced trader.
No manual drawing. No hours of study. Just upload and understand.
WHAT YOU GET FROM EVERY CHART
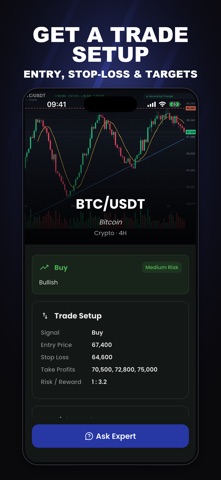
- Trade setup, explained: a sample entry, stop-loss, and target zones so you can see how a plan is structured
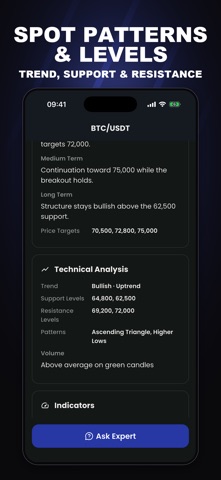
- Key levels: automatic support and resistance, plus the current trend direction
- Chart patterns: candlestick and classic patterns (head & shoulders, triangles, flags) detected and explained
- Technical indicators: RSI, MACD, and momentum read in plain language
- Risk check: risk level, risk/reward, and an AI confidence score for the setup
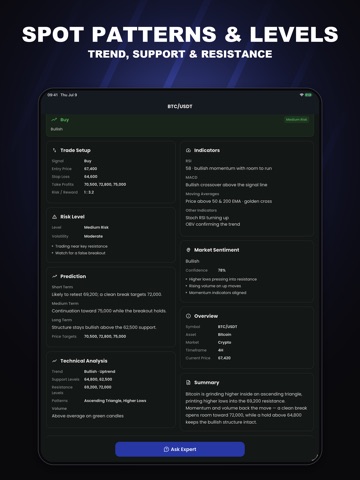
- Market sentiment & outlook: a balanced, educational view of what the chart suggests
READ ANY CHART IN THREE STEPS
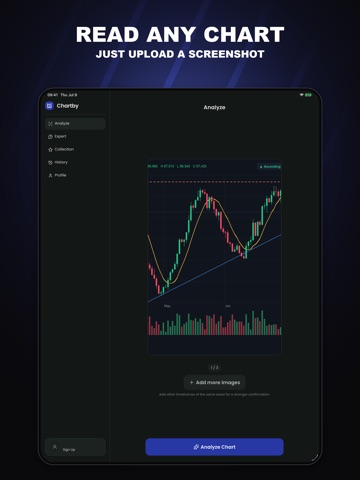
1. Snap or upload a screenshot of any chart, from any app, broker, or website
2. Chartby's AI analyzes the price action, levels, patterns, and indicators
3. Get a structured breakdown you can actually learn from
ASK ABOUT ANY CHART
Not sure why a level matters or what RSI is telling you? Chat with Chartby's AI about your chart, ask about patterns, entries, indicators, and risk, and get clear, educational answers on demand.
BUILT FOR LEARNING
Whether you're new to technical analysis or an active day and swing trader sharpening your eye, Chartby helps you understand the "why" behind every chart. It's like having TradingView-style technical analysis explained to you in seconds, in plain language.
WHY TRADERS CHOOSE CHARTBY
- Works with any market: stocks, crypto, forex, indices, and commodities
- Instant analysis, no waiting, no complicated setup, no data to import
- Plain-language explanations that actually teach you technical analysis
- Learn candlestick patterns, support & resistance, RSI, MACD, and risk management
- Your charts, analyzed privately
WHO IT'S FOR
- Beginners who want to learn how to read a candlestick chart and understand technical analysis
- Day traders and swing traders who want a fast second opinion before they study a setup
- Crypto, stock, and forex enthusiasts who see charts everywhere and want to actually understand them
- Anyone tired of complicated charting tools and endless YouTube tutorials
FRE