Chartly: Stock Analysis

Chartly: Stock Analysis Summary
Chartly: Stock Analysis is a free, with in-app purchases iOS app in Finance by Tanner Bennett. Released in Sep 2025 (11 months ago). It has 1.00 ratings with a 5.00★ (excellent) average. Based on AppGoblin estimates, it reaches roughly 11 monthly active users and generates around $<10K monthly revenue (100% IAP / 0% ads). Store last updated Apr 16, 2026
Chartly: Stock Analysis SDKs Summary
App not yet scanned for SDKs.
5★
Ratings: 1.00
Screenshots
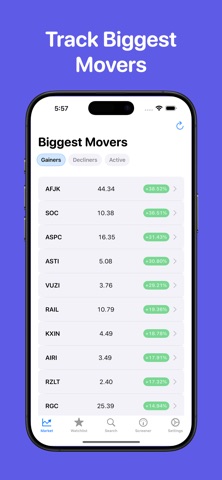
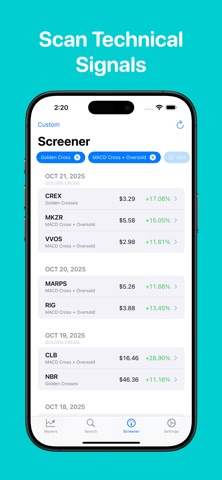
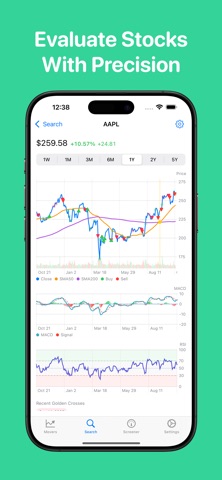

App Description
Chartly: Stock Analysis helps you track the markets with clarity.
Get powerful charts, real-time data, and smart indicators — all in a clean, simple interface. Whether you’re a casual investor or a daily trader, Chartly makes it easy to spot trends, analyze performance, and make confident decisions.
Features:
• Real-time stock quotes and charts
• Technical indicators like SMA, RSI, MACD
• Biggest movers and daily trend tracking
• Custom watchlists for your favorite tickers
• Clean, intuitive design for quick insights
Stay ahead of the markets with Chartly: Stock Analysis.
Terms of Use: https://www.apple.com/legal/internet-services/itunes/dev/stdeula/