PhosphorSol

PhosphorSol Summary
PhosphorSol is a mobile iOS app in Books And Reference by Stuart Woolley. Released in Feb 2026 (7 months ago). Store last updated Sep 14, 2026
PhosphorSol SDKs Summary
App not yet scanned for SDKs.
0★
Ratings: 0
Screenshots

App Description
PhosphorSol is a real-time space weather monitoring station for your iPhone, presenting live solar data from NOAA's Space Weather Prediction Center through a retro CRT phosphor display interface.
Track the conditions between the Sun and Earth across six dedicated displays:
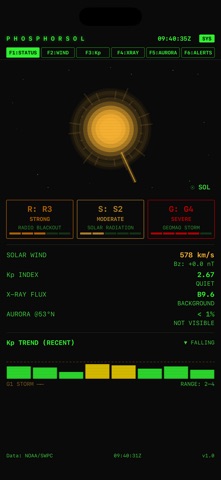
STATUS — Your mission control dashboard. An animated ASCII Sun with shimmering corona sits above the NOAA R/S/G threat scale indicators for radio blackouts, solar radiation storms, and geomagnetic disturbances. At a glance: current solar wind speed, Kp index, X-ray flux classification, and aurora probability at your latitude, with a miniature Kp trend chart showing recent geomagnetic activity.
WIND — Live telemetry from the DSCOVR satellite at the L1 Lagrange point, one million miles sunward. Three scrolling strip-chart traces display solar wind speed, IMF Bz magnetic field component, and proton density in real time. The Bz trace is colour-coded: green when the interplanetary magnetic field points northward (Earth's magnetosphere shielded), red when it swings southward (geomagnetic coupling begins). Six-hour statistics and a conditions reference guide complete the picture.
Kp — The planetary Kp geomagnetic disturbance index rendered as a colour-coded bar chart spanning observed readings and NOAA forecast periods. Bars transition from green through amber to red as storm thresholds are crossed. Below the chart: observed statistics with min/max/average readings, storm period counts, a tabulated 3-hour Kp forecast, and the NOAA G-scale legend from G1 Minor through G5 Extreme.
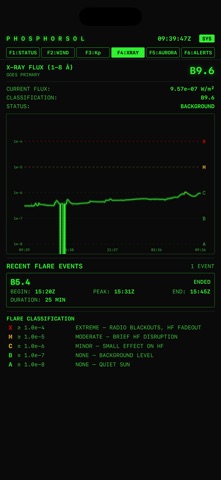
XRAY — Solar X-ray flux from the GOES primary satellite plotted on a logarithmic scale with flare classification thresholds marked at A, B, C, M, and X class levels. The trace changes colour by intensity. Below: a detailed log of recent flare events showing begin, peak, and end times with duration, and a flare classification reference.
AURORA — The OVATION auroral oval model for both northern and southern hemispheres, recoloured to match the CRT aesthetic. A probability reading for your latitude with a block-character meter bar, current Kp versus required Kp for visible aurora at your location, and observation/forecast timestamps.
ALERTS — A scrolling feed of SWPC alerts, warnings, and watches from the last 30 days. Each entry displays the issue timestamp, severity classification, and the substantive co