MagTicker

MagTicker Summary
MagTicker is a with in-app purchases iOS app in Finance by Yung Kei Simon MA. Released in May 2026 (4 months ago). Store last updated Sep 13, 2026
MagTicker SDKs Summary
App not yet scanned for SDKs.
0★
Ratings: 0
Screenshots
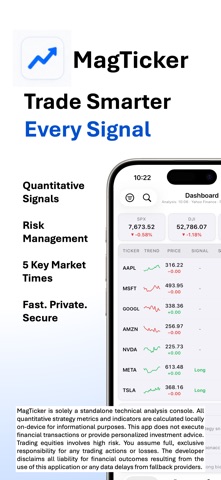


App Description
MagTicker is a market analysis console for swing traders and position traders who focus on the stock market's primary drivers.
Rather than tethering you to sub-second streaming charts that encourage impulsive trading, MagTicker delivers structured analysis at five defined intervals throughout the trading day. It evaluates momentum, volatility, and trend strength on daily horizons so you can execute your strategy from your iPhone with clarity.
WHY MAGTICKER
• Structured Snapshots. No endless scrolling or battery drain. MagTicker refreshes at five intervals: pre-market, open, mid-session, close, and weekly review.
• 11-Indicator Engine. Each snapshot computes EMA stack analysis, ADX/DMI, RSI, Bollinger Bands, Stochastic RSI, rolling VWAP, Fibonacci retracements and extensions, MACD, volume ratio, and ATR risk parameters. All calculations run on-device.
• Directional Bias with Risk Levels. The strategy engine determines a LONG, SHORT, or NEUTRAL bias per symbol and generates entry zone, ATR-derived stop loss, and three take-profit targets at defined reward-to-risk ratios.
• Built for Mega-Cap Equities. Track up to 10 symbols with real-time index context from the S&P 500, Dow Jones, and Nasdaq.
PORTFOLIO MANAGEMENT
• Portfolio Tab. Track positions with an allocation donut chart, performance bars, and a holdings table showing cost basis, market value, and unrealised P&L.
• Long and Short Tracking. Record long and short positions. Sell or close with automatic realised P&L calculation and a full transaction audit trail.
• Analytics. Concentration risk, long/short exposure, bias alignment, win rate, average gain versus loss.
KEY FEATURES
• Candlestick Charts. Daily and hourly resolution with toggleable overlays: EMA 8/21/55/200, Bollinger Bands, VWAP, Fibonacci levels, entry/stop-loss/take-profit markers, volume subplot. Full-screen landscape mode.
• Persistent Data. Historical candle data is cached on-device and survives app restarts. Replay past snapshots with original chart data from notification history.
• Notifications. Five scheduled anchors for UK and US sessions, plus seven intraday alert conditions: RSI extremes, Bollinger Band breakouts, entry zone proximity, volume spikes, and more.
• Multi-Provider. Choose Tiingo, Finnhub, Twelve Data, or Yahoo Finance as your primary source with automatic fallback.
• Privacy. Watchlist, histo