Technical Analysis Data: Gauge

Technical Analysis Data: Gauge Summary
Technical Analysis Data: Gauge is a free, ad-supported iOS app in Finance by Sunandan Sekhar Das. Released in Jul 2026 (3 months ago). It has 1.00 ratings with a 5.00★ (excellent) average. Based on AppGoblin estimates, it reaches roughly 22 monthly active users and generates around $<10K monthly revenue (0% IAP / 100% ads). Store last updated Jul 7, 2026
Technical Analysis Data: Gauge SDKs Summary
App not yet scanned for SDKs.
5★
Ratings: 1.00
Screenshots




App Description
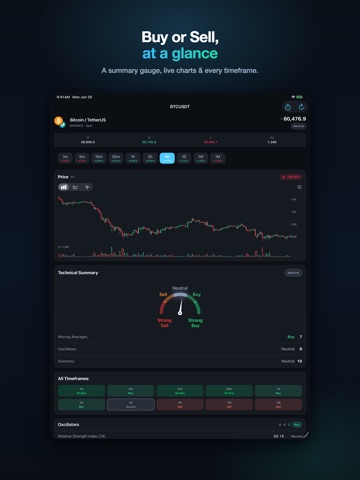
TA Gauge turns the market's technical indicators into a clear Buy / Sell / Neutral read for any crypto, stock, or forex symbol, across 10 timeframes.
- SUMMARY GAUGE: an at-a-glance dial that sums up oscillators and moving averages into Strong Sell to Strong Buy.
- LIVE CHARTS: candlestick, line, and area charts with moving-average and Bollinger overlays, a crosshair, and volume.
- EVERY TIMEFRAME: see the rating from 1-minute to 1-month, and the percent change for each.
- OSCILLATORS & MOVING AVERAGES: the full breakdown (RSI, Stochastic, CCI, ADX, MACD, EMAs/SMAs) with each indicator's signal.
- WATCHLIST: track symbols with live ratings, sparklines, and % change; sort and group by category.
- PORTFOLIO: log holdings (multiple lots, notes, buy dates) and watch live value and profit/loss; hide balances or lock with Face ID.
Data and ratings are sourced from public market feeds. TA Gauge is for information and education only and is not financial advice.