Calculus & Probability Lab

Calculus & Probability Lab Summary
Calculus & Probability Lab is a free, ad-supported, with in-app purchases iOS app in Education by MEHMET CANKER (TR). Released in Aug 2026 (1 month ago). Store last updated Aug 13, 2026
Calculus & Probability Lab SDKs Summary
App not yet scanned for SDKs.
0★
Ratings: 0
Screenshots


App Description
Calculus & Probability Lab turns two of the hardest STEM subjects into something you can see, touch, and drag with your finger. Instead of static graphs in a textbook, every derivative, integral, and probability distribution becomes a real 3D object you orbit, zoom, and reshape live.
Whether you're in AP Calculus, a first-year college calculus or statistics course, or just relearning math you forgot, this app trades memorized formulas for visual intuition: drag a point along a curve and watch its tangent-line slope update instantly, or watch a histogram built from real dice tosses close in on the bell curve as you roll.
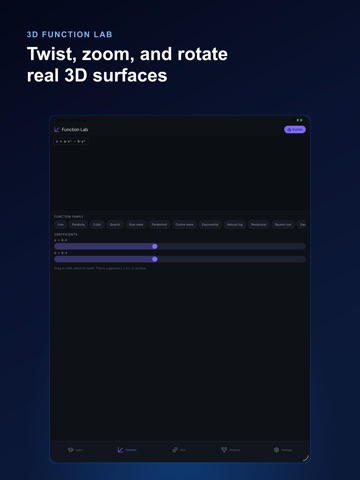
FUNCTION LAB — 3D VISUALIZER
• 22 function families: lines, parabolas, cubics, quartics, sine/cosine waves, exponentials, natural logs, reciprocals, square roots, Gaussian bumps, logistic S-curves
• Genuine z = f(x, y) surfaces — paraboloids, saddles, Gaussian hills, ripples, sphere caps, cones, tilted planes, monkey saddles, egg-carton surfaces, twin peaks — drag to orbit, pinch to zoom
• Live tangent-line overlay — move a point along any curve and watch the exact derivative f'(x) recompute in real time
• Riemann sum overlay — slide from 1 to 60 rectangles and watch the sum converge to the exact definite integral
• Every formula is closed-form and exact — no approximation, no drift
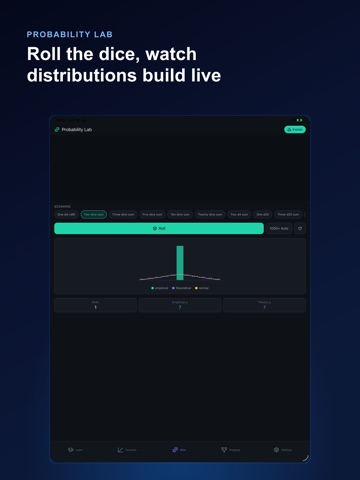
PROBABILITY LAB — PHYSICS DICE
• Toss physics-simulated dice and build a genuine empirical histogram, roll after roll
• Scenarios span dice-sum outcomes, coin-flip binomial trials, and Poisson arrival processes
• Overlay your empirical results against the exact theoretical distribution on the same chart
• Watch the Central Limit Theorem happen live: enough trials and the histogram closes in on the normal curve
• Track empirical mean against theoretical mean at every roll
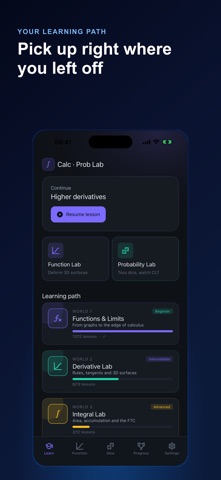
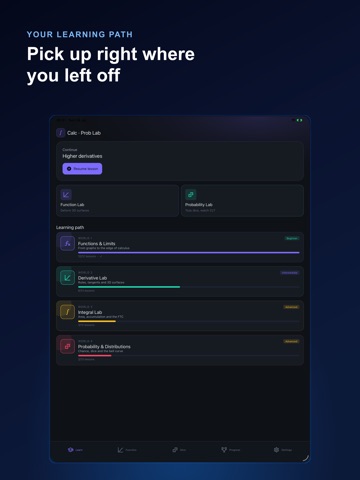
LEARNING PATH — 4 WORLDS, ~50 LESSONS
• World 1, Functions & Limits: what a function is, families of functions, slope, one- and two-sided limits, continuity, average vs. instantaneous rate of change, exponentials and logs
• World 2, Derivative Lab: the derivative as slope, power/product/quotient/chain rules, higher derivatives, tangent planes and partial derivatives, critical points, related rates, optimization, the Mean Value Theorem
• World 3, Integral Lab: area under a curve, Riemann sums, the definite integral, antiderivatives, the Fundamental Theo