PG Surface Pressure Charts EU
PG Surface Pressure Charts EU Summary
PG Surface Pressure Charts EU is a mobile Android app in Sports by Jan Cees Venema. Released in Aug 2017 (8 years ago). It has about 19.8K+ installs Based on AppGoblin estimates, it reaches roughly 611 monthly active users . Store metadata: updated Jun 15, 2024.
Recent activity: 316 installs this week (653 over 4 weeks) showing exceptional growth View trends →
Store info: Last updated on Google Play on Jun 15, 2024 .
0★
Ratings: 0
Screenshots

App Description
5-Day meteo forecasts to prepare for your paragliding flights in Europe
For proper flight planning, information on meteo conditions are indispensable. The Surface Pressure Forecast Charts App will give you a 5-day outlook on the possible development of the large scale meteo conditions in Europe.
The charts have the purpose to merely supply you with large scale, longer term info. To assess local conditions you will have to consult other sources, like burnair Map, spotAIR FFVL, Meteo Parapente, Paraglidable or Windy.
To be able to download the charts even in marginal internet connectivity conditions, the charts are supplied as low-resolution images, minimizing the file size.
Higher resolution images and zooming capability would suggest a reliability of the model outputs at a smaller scale. This has been discouraged by the meteorologists involved.
The app is light, fast and very easy to use. Morever it is free and without ads!
Features:
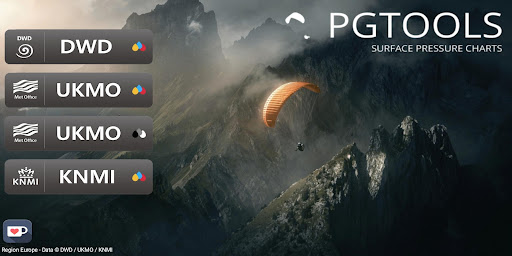
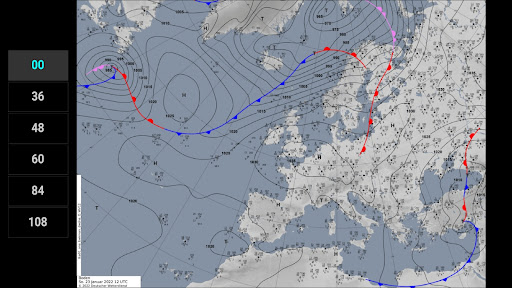
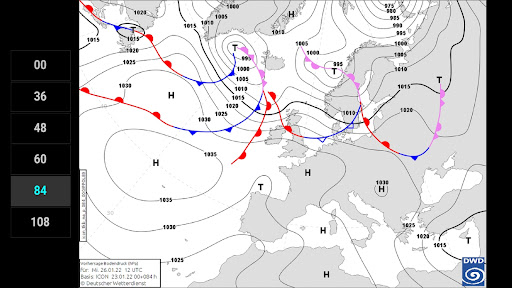
• DWD analysis for +00 and forecasts for 36, 48, 60, 84 and 108 hours
• UKMO analysis for +00 and forecasts for 12, 24, 36, 48, 60, 72, 84, 96 and 120 hours
• KNMI analysis for +00 and forecasts for 12, 24 and 36 hours
• isobars
• sea level pressure (hPa)
• frontal systems (heat and cold fronts)
• thickness data (in UKMO B/W charts)
The charts are generated and generously made available by DWD, UKMO, KNMI and Wetterzentrale.de.
The models used are:
DWD - ICON-model
UKMO - Unified Model
KNMI - HARMONIE-AROME