mm Graph
mm Graph Summary
mm Graph is a ad-supported Android app in Education by MONALI PODDAR and ABHIJIT PODDAR. Released in Apr 2019 (6 years ago). It has about 69.7K+ installs and 154 ratings with a 2.67★ (poor) average. Based on AppGoblin estimates, it reaches roughly 99 monthly active users and generates around $<10K monthly revenue (0% IAP / 100% ads). Store metadata: updated Jun 6, 2023.
Recent activity: 3.00 installs this week (51 over 4 weeks) showing declining growth View trends →
Store info: Last updated on Google Play on Jun 6, 2023 .
2.67★
Ratings: 154
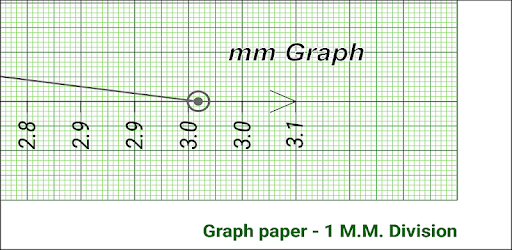
Screenshots


App Description
A free android app to help you plot X-Y data easily on a mm-division graph paper
Welcome to "mm Graph", a free graph plotting android app to help you plot two-dimensional X-Y data on a mm-division graph-paper very easily.
If you are a student having difficulty in plotting your data on a millimeter-division graph paper, you should download the mm 'Graph app'. The app would guide you step by step in marking the data points on the mm-division graph paper, along with showing you all the relevant calculations.
If you want to accomplish more with the app, you need to get the Pro version, namely 'mm Graph Pro', from Google Play Store.
With the Pro version, you may additionally:
* Draw your graph anywhere on the mm-division graph-paper by shifting the origin, by changing the axes-margins etc.
* Perform custom grid-scaling i.e. change the values corresponding to the smallest scale (1 mm) divisions along the X and Y axes.
* Import data already saved in files in your device into your app in different formats and different layouts. You may also edit the imported data before plotting.
* Make use of an embedded clock and stop-watch to take data readings which require a timer.
* Plot up to five sets of data, for e.g., five sets of drain-current versus drain-to-source voltage for different gate-to-source voltages in a JFET transistor.
* Plot as many data points as you wish.
* Orient the graph paper vertically or horizontally for an optimum plot.
* Even after a graph is drawn, you may edit X-Y values for a data point or delete a data point from the graph and replot.
* Modify the X and Y axis variables, for e.g., change X to log(X), Y to 1/Y etc.
* Insert text and arrow annotations on your graph to highlight important facets.
* Record the details of your lab-assignment related to the plotted graph.
* Save the full-sized e-graph (which exactly mimics an actual millimeter-division graph paper) with the plotted data into your mobile device.
* Also save the X-Y data set(s) to your device in different formats like .dat, .csv, .txt etc so that you may plot them later with your 'mm Graph Pro' app or any other graphing software if you so wish.
* Share your saved data and image files with your teacher, classmates, friends or anybody through WhatsApp or email from right inside the app.
* Get answers to 'Frequently asked questions'
And more ....
While students of all ages and disciplines are bound to find