React Native Charts
187 installs
7.00 ratings
16 monthly active users
$<10K monthly revenue est.
IAP 0% · Ad 100%
Install Trends
Weekly +10
Trending
Monthly +42
Trending
React Native Charts Summary
React Native Charts is a ad-supported Android app in Education by Awadhesh Chaurasia. Released in Sep 2022 (3 years ago). It has about 187+ installs and 7.00 ratings . Based on AppGoblin estimates, it reaches roughly 16 monthly active users and generates around $<10K monthly revenue (0% IAP / 100% ads). Store metadata: updated Jan 23, 2023.
Recent activity: 10 installs this week (42 over 4 weeks) showing exceptional growth View trends →
Store info: Last updated on Google Play on Jan 23, 2023 .
0★
Ratings: 7.00
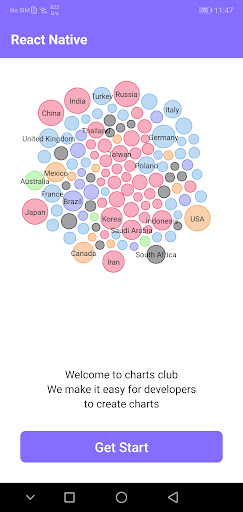
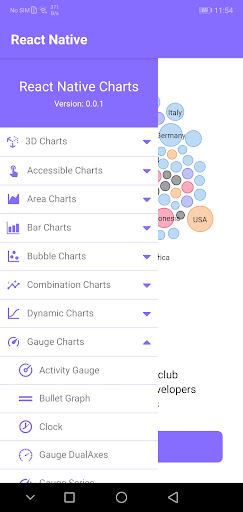
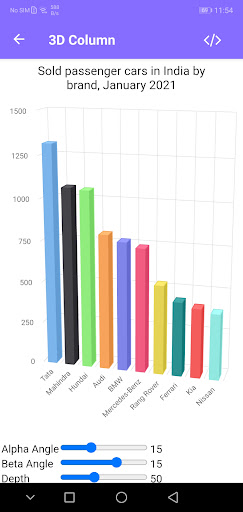
Screenshots

App Description
React native charts creator or tutorial for beginners.
We are using Highcharts.
ref: https://www.highcharts.com/