DSB Analytics
DSB Analytics Summary
DSB Analytics is a mobile Android app in Productivity by PSB Alliance Pvt Ltd. It has about 831+ installs Based on AppGoblin estimates, it reaches roughly 61 monthly active users . Store metadata: updated Oct 6, 2025.
Recent activity: 11 installs this week (34 over 4 weeks) showing below average growth View trends →
Store info: Last updated on Google Play on Oct 6, 2025 .
0★
Ratings: 0
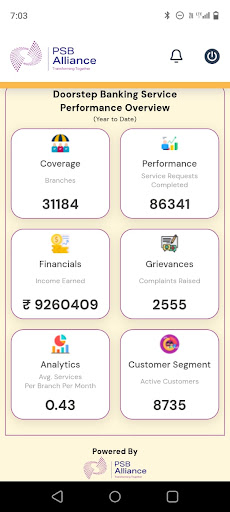
Screenshots


App Description
DSB Dashboard: Enhancing Customer Experience and Operational Efficiency
Doorstep banking (DSB) has transformed the banking experience by providing services directly to customers' locations. To ensure the effectiveness and efficiency of these services, banks must utilize a comprehensive analytics dashboard. This dashboard should track key metrics such as coverage, performance, financials, grievances, and customer segmentation.
Doorstep Banking Dashboard:
1. Coverage
Active and Inactive Status:
* Branches:
* Current Month: Number of active and inactive branches.
* Current Quarter: Quarterly trend of active and inactive branches.
* Current Financial Year: Yearly trend of active and inactive branches.
* Centres:
* Current Month: Number of active and inactive centres.
* Current Quarter: Quarterly trend of active and inactive centres.
* Current Financial Year: Yearly trend of active and inactive centres.
* Zones:
* Current Month: Number of active and inactive zones.
* Current Quarter: Quarterly trend of active and inactive zones.
* Current Financial Year: Yearly trend of active and inactive zones.
* Customers:
* Current Month: Number of active and inactive customers.
* Current Quarter: Quarterly trend of active and inactive customers.
* Current Financial Year: Yearly trend of active and inactive customers.
2. Performance
Target versus Actual Services Completed:
* Current Month:
* Number of services targeted versus actual services completed.
* Current Quarter:
* Quarterly comparison of targeted services versus actual services completed.
* Current Financial Year:
* Yearly comparison of targeted services versus actual services completed.
3. Financials
Total Revenue and Total Income Earned:
* Current Month:
* Total revenue generated.
* Total income earned from completed services.
* Current Quarter:
* Quarterly revenue and income trends.
* Current Financial Year:
* Yearly revenue and income trends.
4. Grievances
Raised and Resolved Complaints within TAT (Turn Around Time):
* Current Month:
* Number of complaints raised.
* Number of complaints resolved within TAT.
* Current Quarter:
* Quarterly trend of raised and resolved complaints within TAT.
* Current Financial Year:
* Yearly trend of raised and resolved complaints within TAT.
5. Analytics
Average Transaction per Branch per Month:
* Current Month:
* Average number of transactions per branch.
* Current Quarter:
* Quarterly average number of transactions per branch.
* Current Financial Year:
* Yearly average number of transactions per branch.
Service Contribution:
* Current Month:
* Contribution of different services to the overall transactions.
* Current Quarter:
* Quarterly service contribution trends.
* Current Financial Year:
* Yearly service contribution trends.
6. Customer Segment
Service Booked by Customer:
* Current Month:
* Number of services booked by individual customers.
* Current Quarter:
* Quarterly trend of services booked by customers.
* Current Financial Year:
* Yearly trend of services booked by customers.
Service Booked by Branch:
* Current Month:
* Number of services booked per branch.
* Current Quarter:
* Quarterly trend of services booked by branches.
* Current Financial Year:
* Yearly trend of services booked by branches.
Top 5 Services:
* Current Month:
* Top 5 most booked services.
* Current Quarter:
* Quarterly ranking of top 5 services.
* Current Financial Year:
* Yearly ranking of top 5 services.