Simple Battery Graph
Simple Battery Graph Summary
Simple Battery Graph is a ad-supported, with in-app purchases Android app in Tools by Salt. Released in May 2019 (7 years ago). It has about 33.7K+ installs and 341 ratings with a 4.39★ (good) average. Based on AppGoblin estimates, it reaches roughly 571 monthly active users and generates around $<10K monthly revenue (37% IAP / 63% ads). Store metadata: updated Nov 23, 2025.
Recent activity: 42 installs this week (175 over 4 weeks) showing steady growth View trends →
Store info: Last updated on Google Play on Nov 23, 2025 .
4.39★
Ratings: 341
Screenshots


App Description
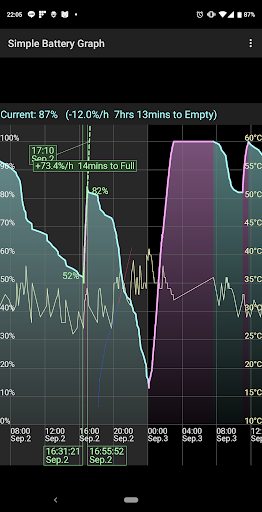
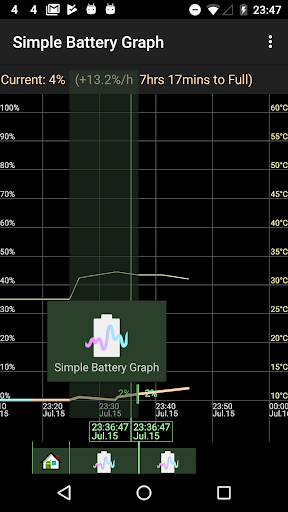
Simple Battery Graph displays an interactive graph of battery level.
Simple Battery Graph displays an interactive graph of battery level.
You can measure how much energy is consumed/charged per hour.
*** If the graph is not updated, please disable the battery optimization for this app by the Android settings. You can open it from the menu of this app. ***
How to use:
- Drag on graph to scroll
- Pinch in/out on graph to change time-axis
- Drag green label on the bottom to change measurement period
(Thick short green line indicates actual recorded point which is automatically chosen nearest point from thin green line)
Battery level is recorded for only latest 10 days.
A sine wave graph is generated as a sample at the first startup and it will be removed after 10 days.
I have confirmed this app works on the following devices:
- Essential Phone PH-1 / Android 10
- Xperia 1 / Android 9
- Nexus 6 / Android 7.1.1