Stock Chart
Stock Chart Summary
Stock Chart is a ad-supported Android app in Finance by Stoxline. Released in Apr 2024 (2 years ago). It has about 517+ installs Based on AppGoblin estimates, it reaches roughly 151 monthly active users and generates around $<10K monthly revenue (0% IAP / 100% ads). Store metadata: updated Mar 1, 2026.
Recent activity: 2.00 installs this week (172 over 4 weeks) showing steady growth View trends →
Store info: Last updated on Google Play on Mar 1, 2026 .
0★
Ratings: 0
Screenshots


App Description
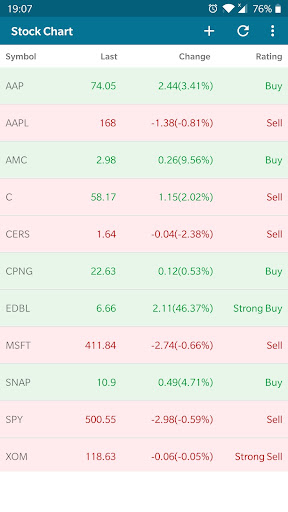
Stock Ratings and Stock technical analysis charts for US stock markets stocks
Stock Ratings and Stock technical analysis charts for US stock markets stocks
App Features:
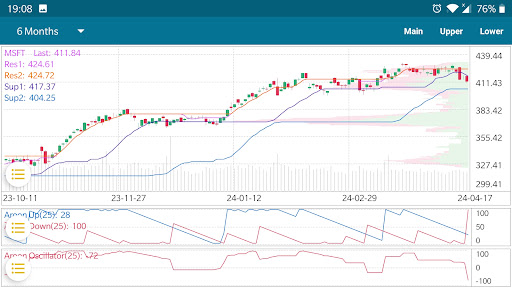
1. Stock analysis charts: Bollinger Bands (BOLL), Chandelier Exit (Long), Exponential Moving Average (10,50), Exponential Moving Average (20,100), Keltner Channels, Price Channels, Simple Moving Average (10,50), Simple Moving Average (20,100), Stoxline Support and Resistance, Weighted Moving Average (WMA).
2. Stock analysis indicators: Accumulation Distribution Line, Aroon Up and Down , Aroon Oscillator , Average Directional Index (ADX), Average True Range (ATR) , Commodity Channel Index (CCI), Chaikin Money Flow (CMF), Chaikin Oscillator, Coppock Curve, Ease of Movement (EMV), Force Index, Full Stochastics, MACD, Mass Index, Money Flow (MFI), On Balance Volume (OBV), %B Indicator, Rate of Change (ROC), Relative Strength Index (RSI), TREND, Williams %R (%R)
3. Multi-time frame charts.
4. Stock real time quote.
5. Real time Buy, Sell or Neutral signals.
6. Free.